| Red | Green | Blue | |
| z | 17.64 | ||
| znorm | Inf | ||
| sky | -Inf | -NaN | -Inf |
| S/N | 25.5 | 43.1 | 45.7 |
| S/N(c) | 0.0 | 0.0 | 0.0 |
| SN(E/C) |
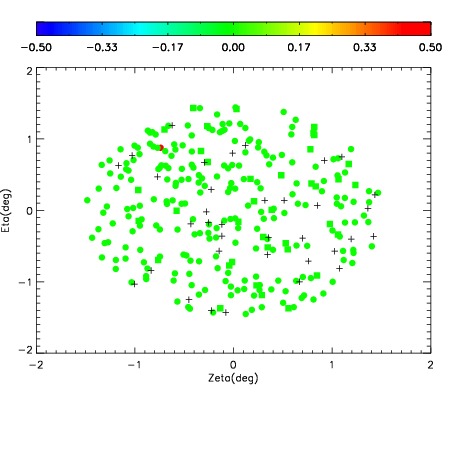
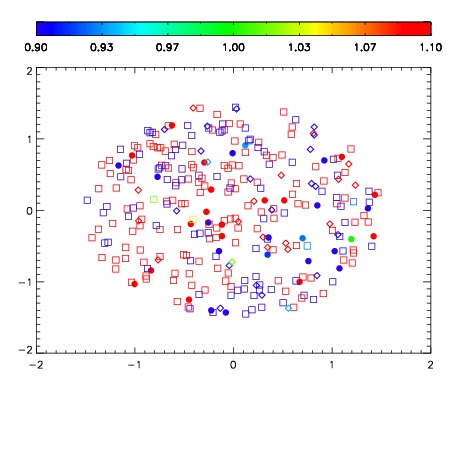


| Frame | Nreads | Zeropoints | Mag plots | Spatial mag deviation | Spatial sky 16325A emission deviations (filled: sky, open: star) | Spatial sky continuum emission | Spatial sky telluric CO2 absorption deviations (filled: H < 10) | |||||||||||||||||||||||
| 0 | 0 |
|
|
|
|
|
|
| IPAIR | NAME | SHIFT | NEWSHIFT | S/N | NAME | SHIFT | NEWSHIFT | S/N |
| 0 | 09770017 | 0.513008 | 0.00000 | 188.905 | 09770018 | 0.00135679 | 0.511651 | 190.772 |
| 1 | 09770021 | 0.511902 | 0.00110602 | 195.617 | 09770022 | -0.00154696 | 0.514555 | 195.951 |
| 2 | 09770020 | 0.510904 | 0.00210398 | 194.352 | 09770019 | 0.000547526 | 0.512460 | 194.325 |
| 3 | 09770016 | 0.512685 | 0.000322998 | 181.992 | 09770015 | 0.00000 | 0.513008 | 181.691 |