| Red | Green | Blue | |
| z | 17.64 | ||
| znorm | Inf | ||
| sky | -NaN | -Inf | -Inf |
| S/N | 24.7 | 41.2 | 46.5 |
| S/N(c) | 0.0 | 0.0 | 0.0 |
| SN(E/C) |
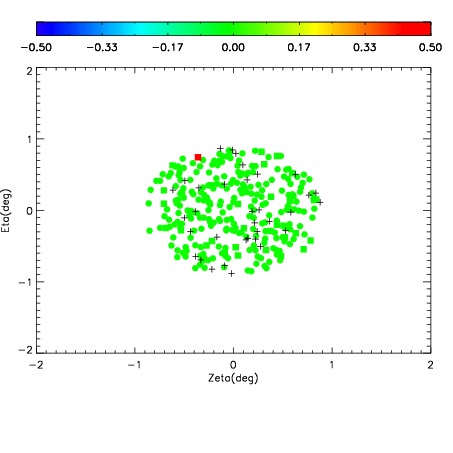
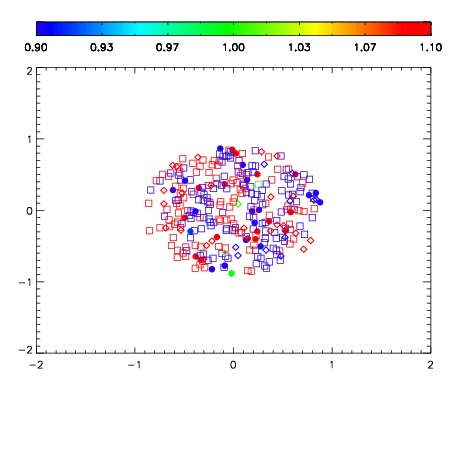


| Frame | Nreads | Zeropoints | Mag plots | Spatial mag deviation | Spatial sky 16325A emission deviations (filled: sky, open: star) | Spatial sky continuum emission | Spatial sky telluric CO2 absorption deviations (filled: H < 10) | |||||||||||||||||||||||
| 0 | 0 |
|
|
|
|
|
|
| IPAIR | NAME | SHIFT | NEWSHIFT | S/N | NAME | SHIFT | NEWSHIFT | S/N |
| 0 | 12500057 | 0.491015 | 0.00000 | 189.799 | 12500056 | -0.00323043 | 0.494245 | 197.439 |
| 1 | 12500054 | 0.490978 | 3.69847e-05 | 206.588 | 12500052 | 0.00000 | 0.491015 | 211.921 |
| 2 | 12500053 | 0.490236 | 0.000778973 | 203.408 | 12500055 | -0.00195896 | 0.492974 | 198.822 |
| 3 | 12500058 | 0.490558 | 0.000456989 | 176.656 | 12500059 | -0.00312928 | 0.494144 | 150.003 |