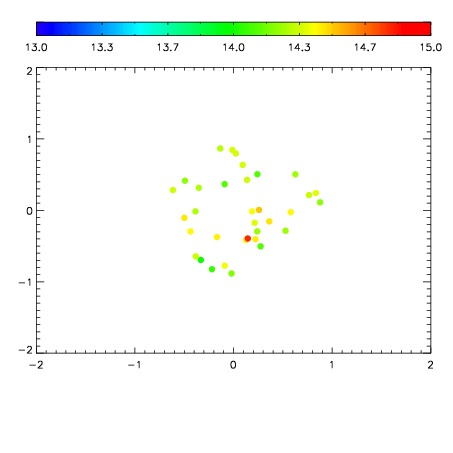
| Frame | Nreads | Zeropoints | Mag plots
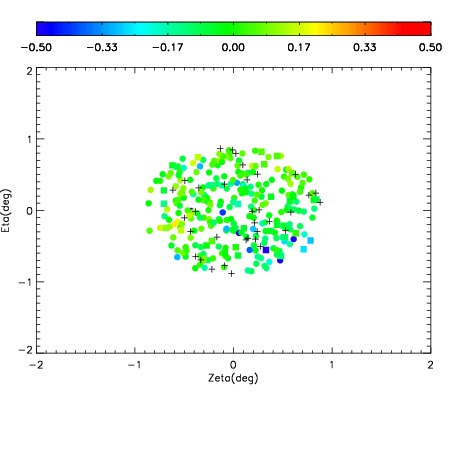
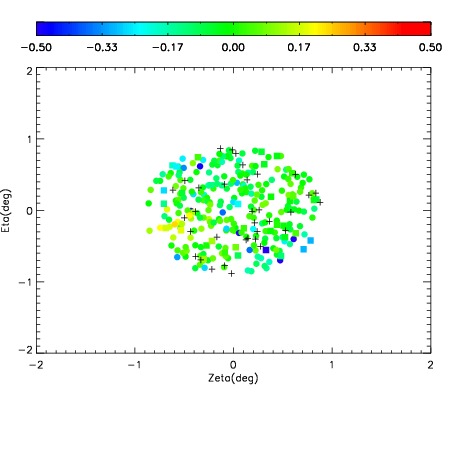
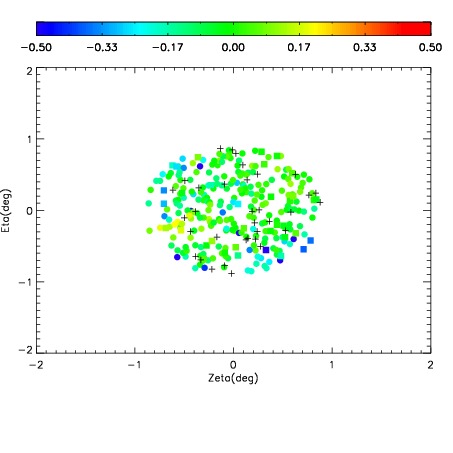
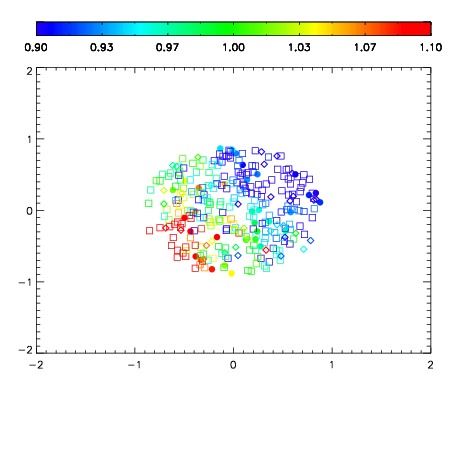
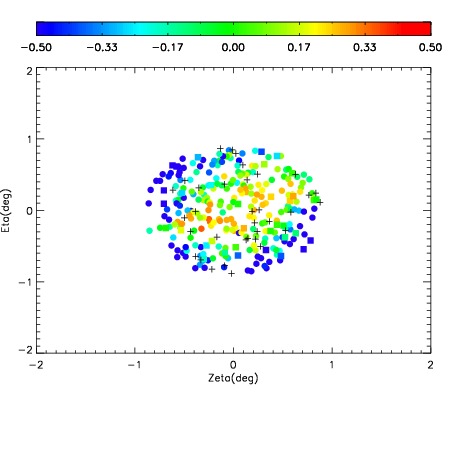
| Spatial mag deviation
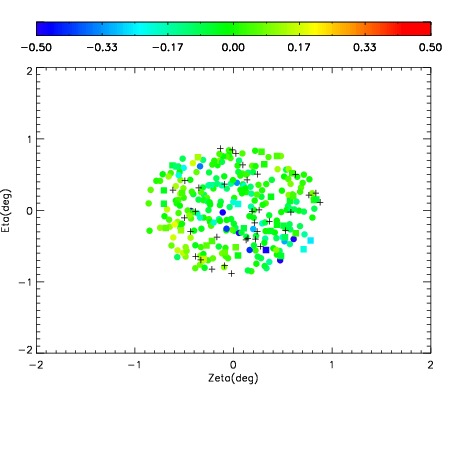
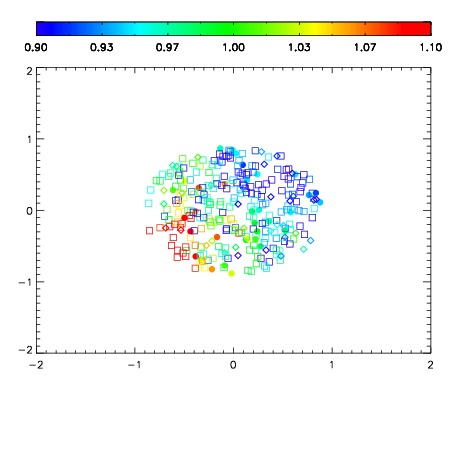
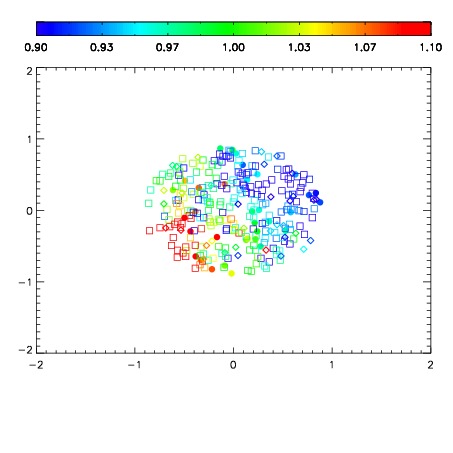
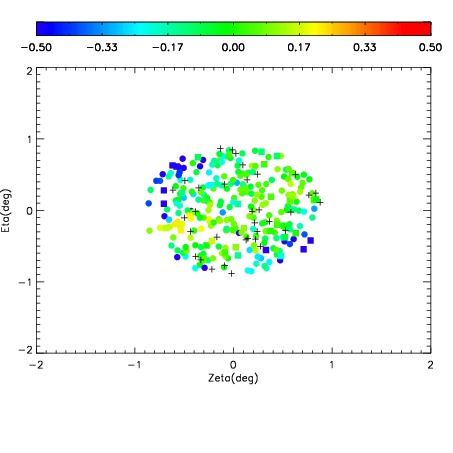
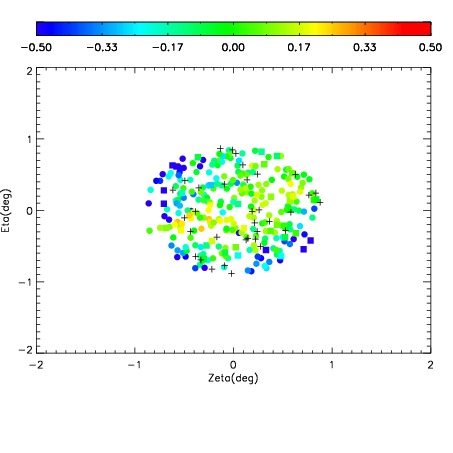
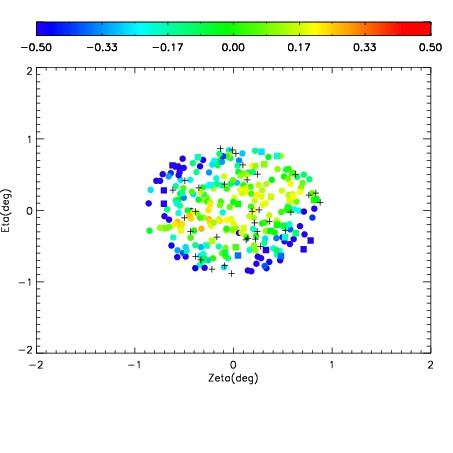
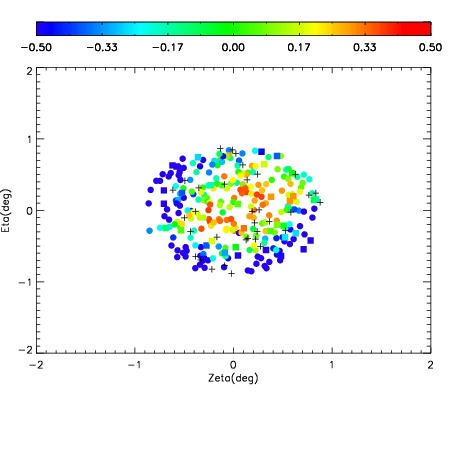
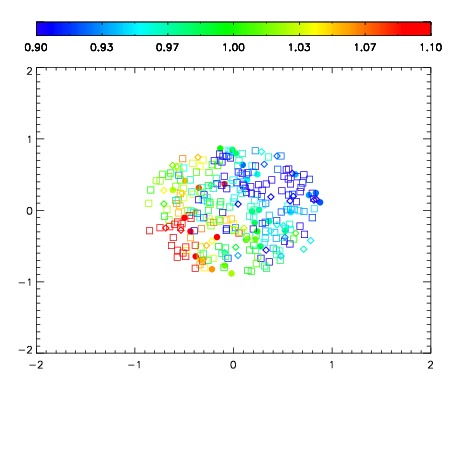
| Spatial sky 16325A emission deviations (filled: sky, open: star)
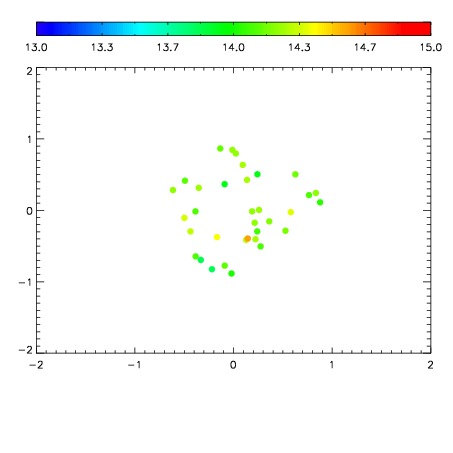
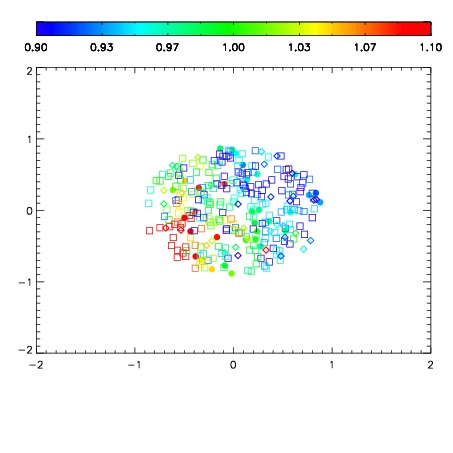
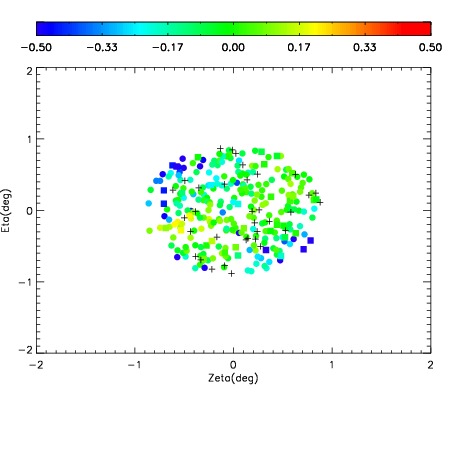
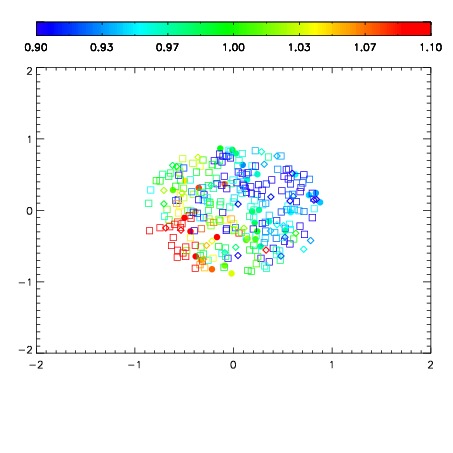
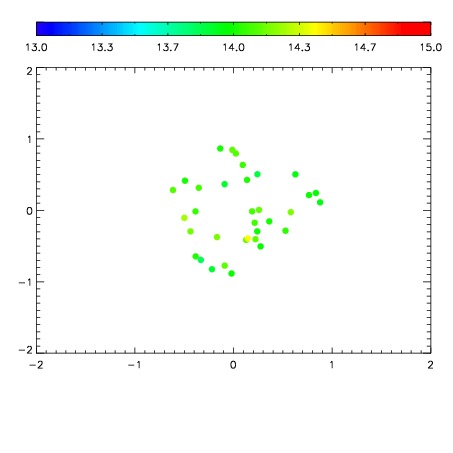
| Spatial sky continuum emission
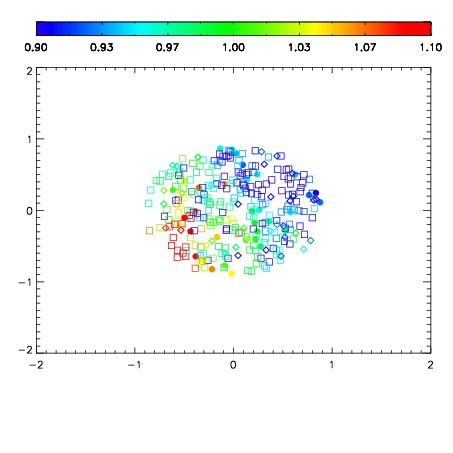
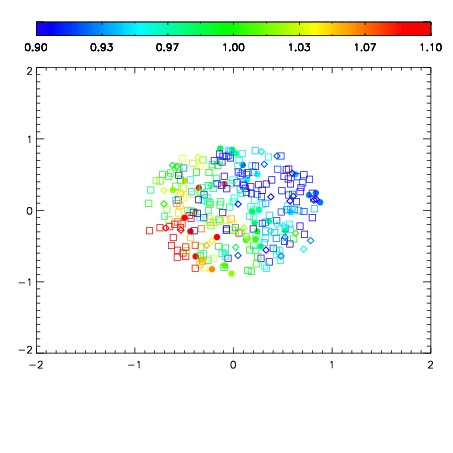
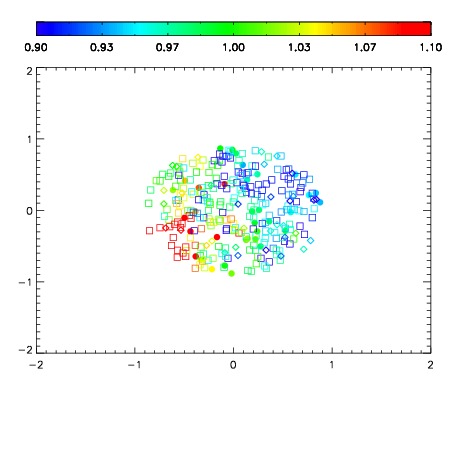
| Spatial sky telluric CO2 absorption deviations (filled: H < 10)
|
| 12510035
| 47
| | Red | Green | Blue
| | z | | 18.82
| | znorm | | 14.64
| | sky | 14.5 | 14.3 | 14.0
| | S/N | 13.5 | 21.7 | 21.3
| | S/N(c) | 11.6 | 19.7 | 20.0
| | SN(E/C) 0.91
|
| 
| 
| 
| 
| 
|
| 12510036
| 47
| | Red | Green | Blue
| | z | | 18.82
| | znorm | | 14.64
| | sky | 14.2 | 14.2 | 14.2
| | S/N | 13.6 | 22.0 | 21.7
| | S/N(c) | 11.9 | 19.9 | 20.0
| | SN(E/C) 0.93
|
| 
| 
| 
| 
| 
|
| 12510037
| 47
| | Red | Green | Blue
| | z | | 18.97
| | znorm | | 14.79
| | sky | 14.1 | 14.1 | 14.1
| | S/N | 14.9 | 23.7 | 24.0
| | S/N(c) | 13.0 | 21.8 | 22.5
| | SN(E/C) 0.95
|
| 
| 
| 
| 
| 
|
| 12510038
| 47
| | Red | Green | Blue
| | z | | 18.97
| | znorm | | 14.79
| | sky | 14.2 | 14.1 | 14.1
| | S/N | 14.9 | 24.0 | 24.1
| | S/N(c) | 13.0 | 21.9 | 22.5
| | SN(E/C) 0.93
|
| 
| 
| 
| 
| 
|
| 12510039
| 47
| | Red | Green | Blue
| | z | | 18.99
| | znorm | | 14.81
| | sky | 14.2 | 14.2 | 14.0
| | S/N | 15.5 | 24.6 | 24.6
| | S/N(c) | 13.7 | 22.5 | 23.1
| | SN(E/C) 0.91
|
| 
| 
| 
| 
| 
|
| 12510040
| 47
| | Red | Green | Blue
| | z | | 18.97
| | znorm | | 14.79
| | sky | 14.3 | 14.3 | 14.1
| | S/N | 15.2 | 24.4 | 24.6
| | S/N(c) | 13.5 | 22.3 | 22.9
| | SN(E/C) 0.93
|
| 
| 
| 
| 
| 
|
| 12510041
| 47
| | Red | Green | Blue
| | z | | 18.88
| | znorm | | 14.70
| | sky | 14.2 | 14.2 | 14.1
| | S/N | 14.9 | 23.8 | 24.0
| | S/N(c) | 13.1 | 21.8 | 22.4
| | SN(E/C) 0.94
|
| 
| 
| 
| 
| 
|
| 12510042
| 47
| | Red | Green | Blue
| | z | | 18.88
| | znorm | | 14.70
| | sky | 14.2 | 14.2 | 14.0
| | S/N | 15.6 | 24.7 | 24.8
| | S/N(c) | 13.7 | 22.4 | 22.8
| | SN(E/C) 0.89
|
| 
| 
| 
| 
| 
|
| 12510043
| 47
| | Red | Green | Blue
| | z | | 18.80
| | znorm | | 14.62
| | sky | 14.1 | 14.1 | 14.2
| | S/N | 15.0 | 24.0 | 24.5
| | S/N(c) | 13.2 | 21.9 | 22.7
| | SN(E/C) 0.92
|
| 
| 
| 
| 
| 
|
| 12510044
| 47
| | Red | Green | Blue
| | z | | 18.71
| | znorm | | 14.53
| | sky | 14.2 | 14.2 | 14.2
| | S/N | 14.9 | 23.7 | 24.1
| | S/N(c) | 12.9 | 21.8 | 22.4
| | SN(E/C) 0.94
|
| 
| 
| 
| 
| 
|