| Red | Green | Blue | |
| z | 17.64 | ||
| znorm | Inf | ||
| sky | -NaN | -Inf | -Inf |
| S/N | 28.7 | 48.0 | 49.6 |
| S/N(c) | 0.0 | 0.0 | 0.0 |
| SN(E/C) |
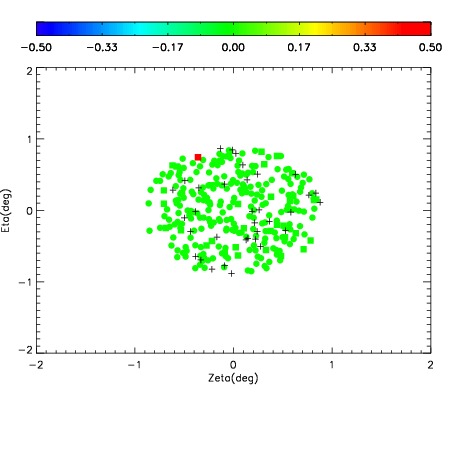
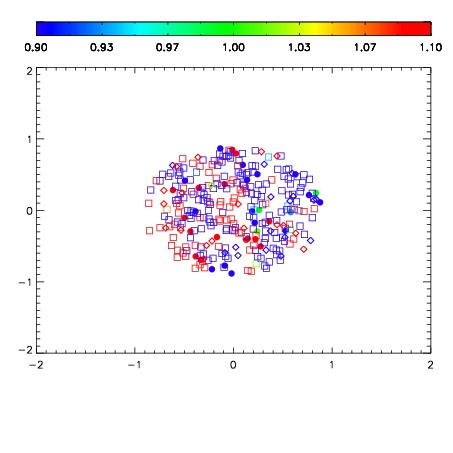


| Frame | Nreads | Zeropoints | Mag plots | Spatial mag deviation | Spatial sky 16325A emission deviations (filled: sky, open: star) | Spatial sky continuum emission | Spatial sky telluric CO2 absorption deviations (filled: H < 10) | |||||||||||||||||||||||
| 0 | 0 |
|
|
|
|
|
|
| IPAIR | NAME | SHIFT | NEWSHIFT | S/N | NAME | SHIFT | NEWSHIFT | S/N |
| 0 | 12510041 | 0.491754 | 0.00000 | 201.855 | 12510042 | 0.00164865 | 0.490105 | 205.088 |
| 1 | 12510040 | 0.491713 | 4.10080e-05 | 204.114 | 12510039 | 0.000711517 | 0.491042 | 205.789 |
| 2 | 12510037 | 0.488776 | 0.00297800 | 200.819 | 12510038 | 0.000411803 | 0.491342 | 200.960 |
| 3 | 12510044 | 0.490558 | 0.00119600 | 195.458 | 12510043 | 0.00155975 | 0.490194 | 200.728 |
| 4 | 12510036 | 0.487654 | 0.00409999 | 186.335 | 12510035 | 0.00000 | 0.491754 | 177.029 |