| Red | Green | Blue | |
| z | 17.64 | ||
| znorm | Inf | ||
| sky | -Inf | -Inf | -Inf |
| S/N | 11.5 | 22.2 | 29.7 |
| S/N(c) | 0.0 | 0.0 | 0.0 |
| SN(E/C) |
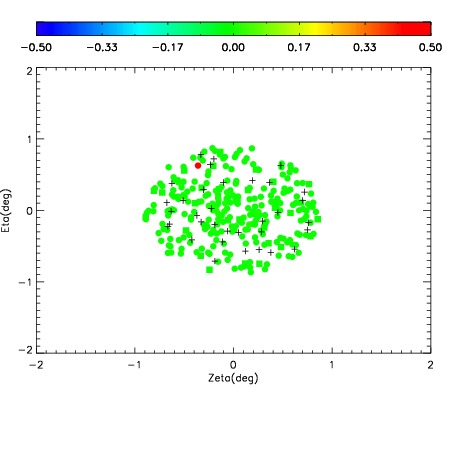
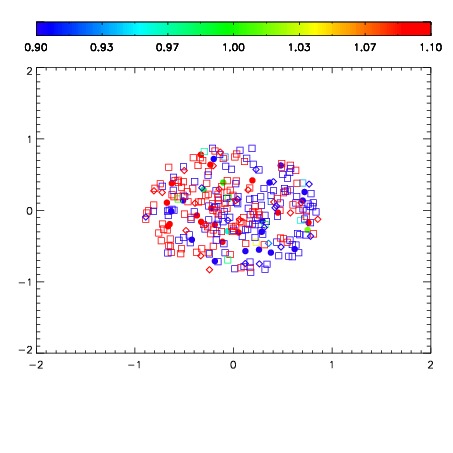
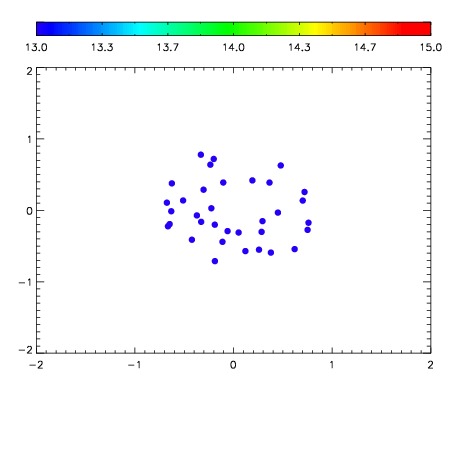

| Frame | Nreads | Zeropoints | Mag plots | Spatial mag deviation | Spatial sky 16325A emission deviations (filled: sky, open: star) | Spatial sky continuum emission | Spatial sky telluric CO2 absorption deviations (filled: H < 10) | |||||||||||||||||||||||
| 0 | 0 |
|
|
|
|
|
|
| IPAIR | NAME | SHIFT | NEWSHIFT | S/N | NAME | SHIFT | NEWSHIFT | S/N |
| 0 | 12490047 | 0.494408 | 0.00000 | 102.972 | 12490046 | 0.000208290 | 0.494200 | 85.0810 |
| 1 | 12490044 | 0.492377 | 0.00203100 | 130.616 | 12490042 | 0.00000 | 0.494408 | 135.083 |
| 2 | 12490048 | 0.494283 | 0.000125021 | 127.265 | 12490049 | -0.000177601 | 0.494586 | 114.385 |
| 3 | 12490043 | 0.492193 | 0.00221500 | 121.903 | 12490045 | 0.000570064 | 0.493838 | 103.246 |