| Red | Green | Blue | |
| z | 17.64 | ||
| znorm | Inf | ||
| sky | -Inf | -Inf | -Inf |
| S/N | 22.1 | 39.6 | 42.0 |
| S/N(c) | 0.0 | 0.0 | 0.0 |
| SN(E/C) |
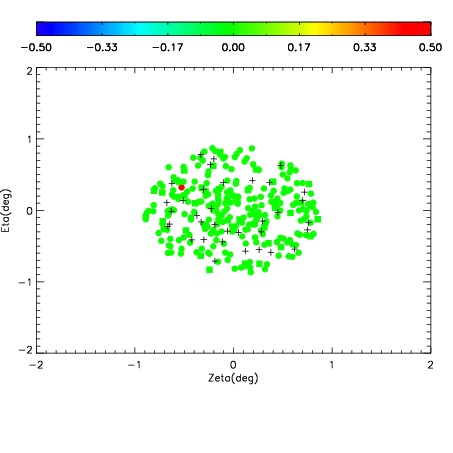
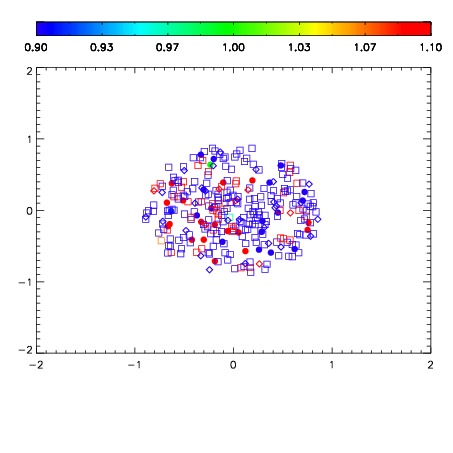
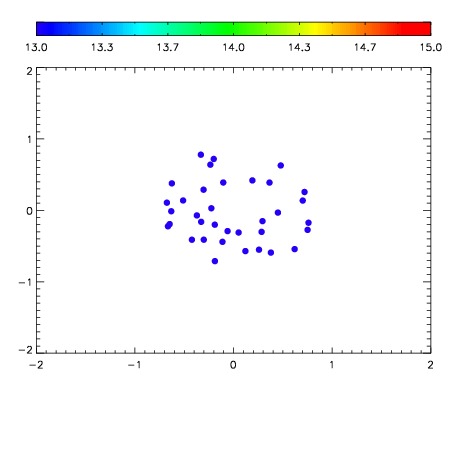

| Frame | Nreads | Zeropoints | Mag plots | Spatial mag deviation | Spatial sky 16325A emission deviations (filled: sky, open: star) | Spatial sky continuum emission | Spatial sky telluric CO2 absorption deviations (filled: H < 10) | |||||||||||||||||||||||
| 0 | 0 |
|
|
|
|
|
|
| IPAIR | NAME | SHIFT | NEWSHIFT | S/N | NAME | SHIFT | NEWSHIFT | S/N |
| 0 | 12550064 | 0.494505 | 0.00000 | 158.006 | 12550066 | 0.000234773 | 0.494270 | 156.160 |
| 1 | 12550060 | 0.489352 | 0.00515300 | 175.553 | 12550059 | 0.00000 | 0.494505 | 167.114 |
| 2 | 12550061 | 0.490343 | 0.00416198 | 174.277 | 12550062 | -0.00128720 | 0.495792 | 165.583 |
| 3 | 12550065 | 0.493526 | 0.000978976 | 165.413 | 12550063 | -0.000588825 | 0.495094 | 163.732 |