| Red | Green | Blue | |
| z | 17.64 | ||
| znorm | Inf | ||
| sky | -Inf | -Inf | -Inf |
| S/N | 23.7 | 41.2 | 42.9 |
| S/N(c) | 0.0 | 0.0 | 0.0 |
| SN(E/C) |
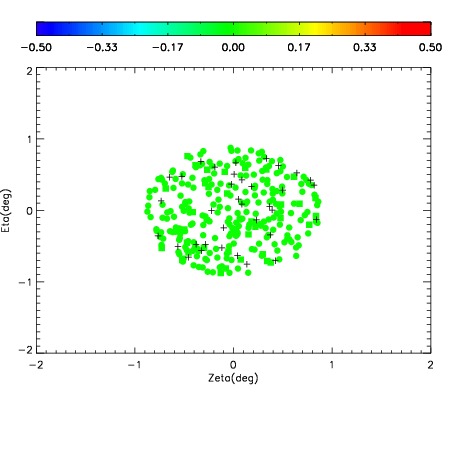
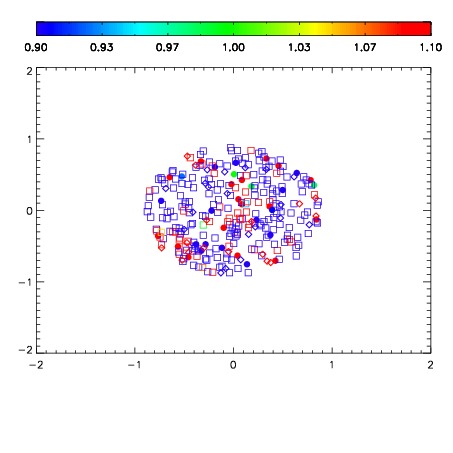
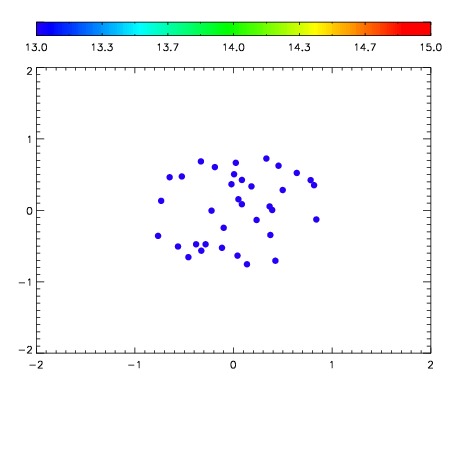

| Frame | Nreads | Zeropoints | Mag plots | Spatial mag deviation | Spatial sky 16325A emission deviations (filled: sky, open: star) | Spatial sky continuum emission | Spatial sky telluric CO2 absorption deviations (filled: H < 10) | |||||||||||||||||||||||
| 0 | 0 |
|
|
|
|
|
|
| IPAIR | NAME | SHIFT | NEWSHIFT | S/N | NAME | SHIFT | NEWSHIFT | S/N |
| 0 | 09070048 | 0.471926 | 0.00000 | 231.963 | 09070047 | 0.00000 | 0.471926 | 234.630 |
| 1 | 09070049 | 0.471664 | 0.000261992 | 229.935 | 09070050 | -0.00700750 | 0.478934 | 227.272 |
| 2 | 09070053 | 0.466653 | 0.00527301 | 223.342 | 09070051 | -0.00807889 | 0.480005 | 222.141 |
| 3 | 09070052 | 0.468203 | 0.00372300 | 216.801 | 09070054 | -0.0110976 | 0.483024 | 208.020 |