| Red | Green | Blue | |
| z | 17.64 | ||
| znorm | Inf | ||
| sky | -Inf | -Inf | -Inf |
| S/N | 28.8 | 48.7 | 52.0 |
| S/N(c) | 0.0 | 0.0 | 0.0 |
| SN(E/C) |
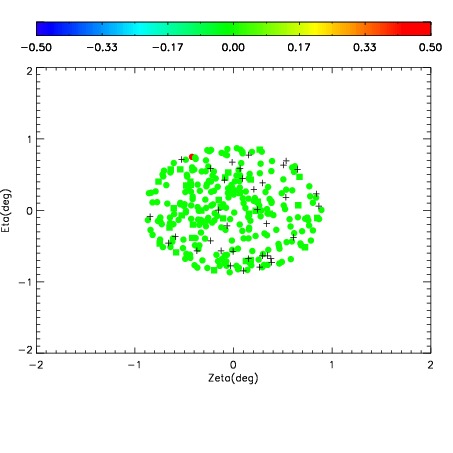
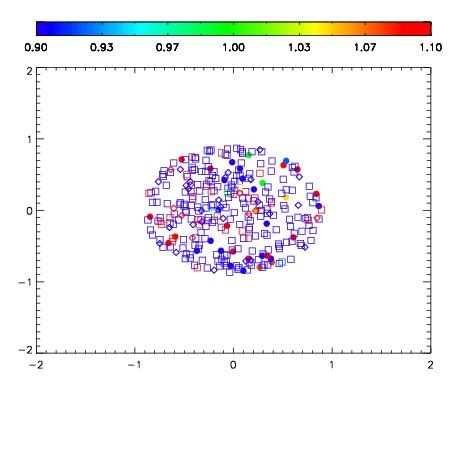
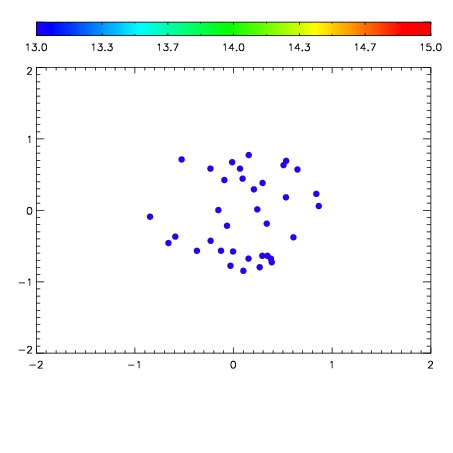

| Frame | Nreads | Zeropoints | Mag plots | Spatial mag deviation | Spatial sky 16325A emission deviations (filled: sky, open: star) | Spatial sky continuum emission | Spatial sky telluric CO2 absorption deviations (filled: H < 10) | |||||||||||||||||||||||
| 0 | 0 |
|
|
|
|
|
|
| IPAIR | NAME | SHIFT | NEWSHIFT | S/N | NAME | SHIFT | NEWSHIFT | S/N |
| 0 | 05240065 | 0.488707 | 0.00000 | 230.537 | 05240070 | 0.00363589 | 0.485071 | 230.385 |
| 1 | 05240068 | 0.488563 | 0.000144005 | 239.707 | 05240067 | 0.000596797 | 0.488110 | 235.548 |
| 2 | 05240069 | 0.488631 | 7.59959e-05 | 233.317 | 05240063 | 0.00000 | 0.488707 | 230.931 |
| 3 | 05240064 | 0.487216 | 0.00149101 | 223.182 | 05240066 | 0.00359647 | 0.485111 | 229.867 |