| Red | Green | Blue | |
| z | 17.64 | ||
| znorm | Inf | ||
| sky | -Inf | -Inf | -Inf |
| S/N | 26.4 | 46.0 | 50.6 |
| S/N(c) | 0.0 | 0.0 | 0.0 |
| SN(E/C) |
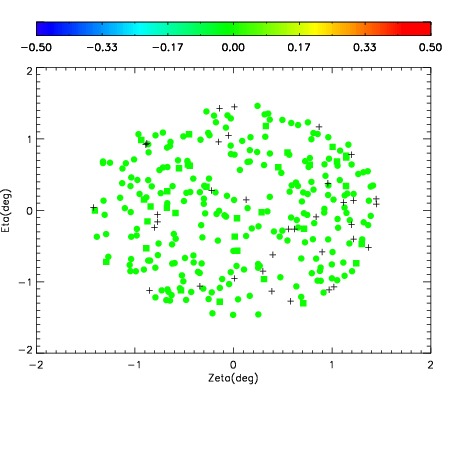
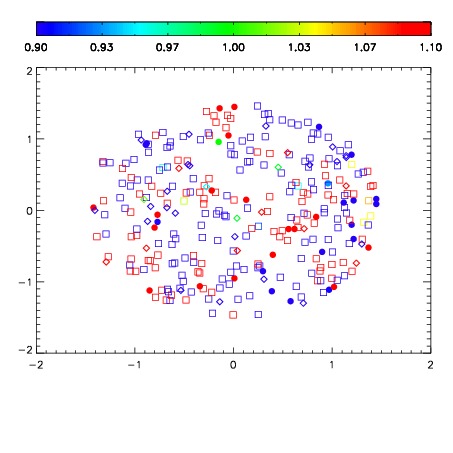
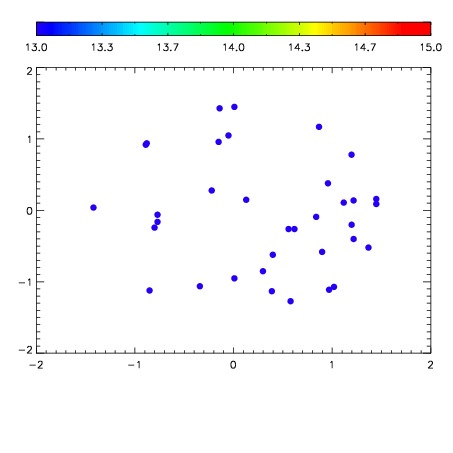

| Frame | Nreads | Zeropoints | Mag plots | Spatial mag deviation | Spatial sky 16325A emission deviations (filled: sky, open: star) | Spatial sky continuum emission | Spatial sky telluric CO2 absorption deviations (filled: H < 10) | |||||||||||||||||||||||
| 0 | 0 |
|
|
|
|
|
|
| IPAIR | NAME | SHIFT | NEWSHIFT | S/N | NAME | SHIFT | NEWSHIFT | S/N |
| 0 | 05150052 | 0.498003 | 0.00000 | 184.836 | 05150053 | 0.00151186 | 0.496491 | 186.967 |
| 1 | 05150056 | 0.497387 | 0.000616014 | 188.363 | 05150057 | 0.00140042 | 0.496603 | 192.301 |
| 2 | 05150055 | 0.496182 | 0.00182101 | 183.843 | 05150054 | 0.00120835 | 0.496795 | 186.558 |
| 3 | 05150051 | 0.496378 | 0.00162500 | 180.259 | 05150050 | 0.00000 | 0.498003 | 175.366 |