| Red | Green | Blue | |
| z | 17.64 | ||
| znorm | Inf | ||
| sky | -Inf | -Inf | -Inf |
| S/N | 24.8 | 42.2 | 46.8 |
| S/N(c) | 0.0 | 0.0 | 0.0 |
| SN(E/C) |
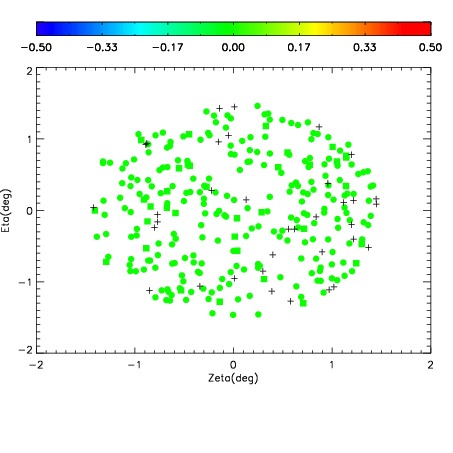
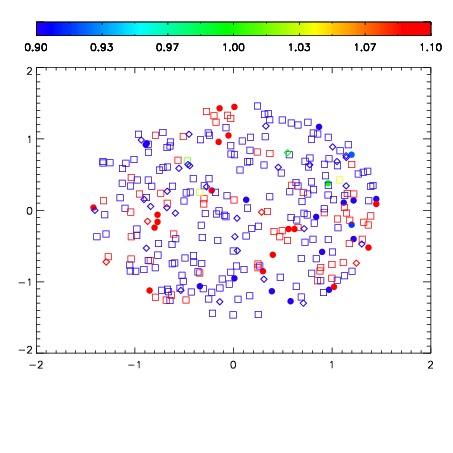
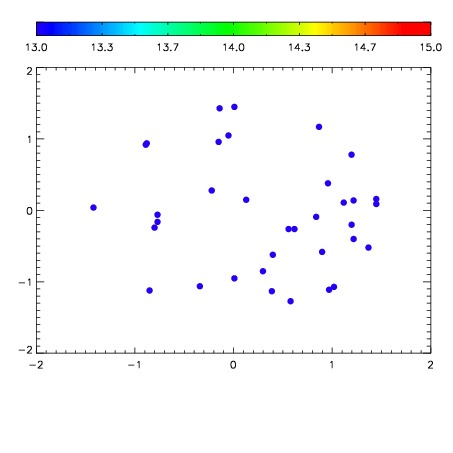

| Frame | Nreads | Zeropoints | Mag plots | Spatial mag deviation | Spatial sky 16325A emission deviations (filled: sky, open: star) | Spatial sky continuum emission | Spatial sky telluric CO2 absorption deviations (filled: H < 10) | |||||||||||||||||||||||
| 0 | 0 |
|
|
|
|
|
|
| IPAIR | NAME | SHIFT | NEWSHIFT | S/N | NAME | SHIFT | NEWSHIFT | S/N |
| 0 | 05200049 | 0.495031 | 0.00000 | 182.672 | 05200051 | -0.00194547 | 0.496976 | 175.984 |
| 1 | 05200053 | 0.493597 | 0.00143400 | 190.077 | 05200054 | -0.000940434 | 0.495971 | 191.784 |
| 2 | 05200052 | 0.493731 | 0.00130001 | 188.040 | 05200050 | 0.00114370 | 0.493887 | 179.713 |
| 3 | 05200048 | 0.492686 | 0.00234500 | 173.926 | 05200047 | 0.00000 | 0.495031 | 171.061 |