| Red | Green | Blue | |
| z | 17.64 | ||
| znorm | Inf | ||
| sky | -Inf | -Inf | -Inf |
| S/N | 24.1 | 41.4 | 45.8 |
| S/N(c) | 0.0 | 0.0 | 0.0 |
| SN(E/C) |

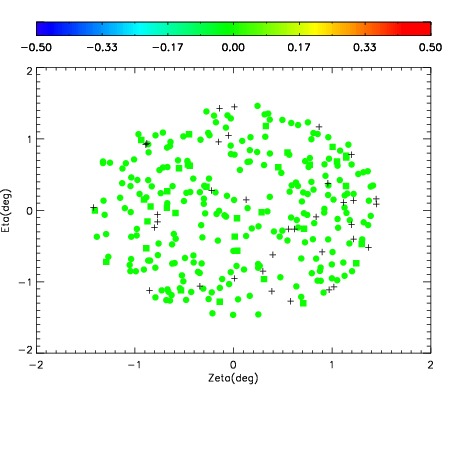

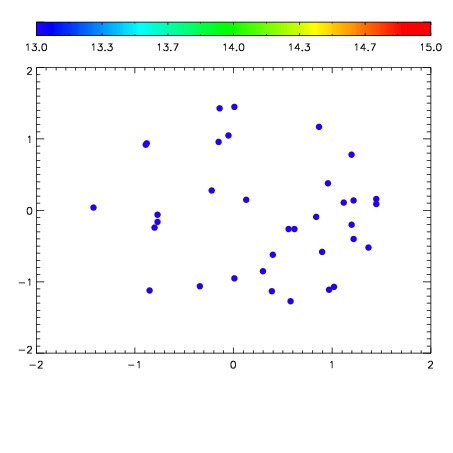

| Frame | Nreads | Zeropoints | Mag plots | Spatial mag deviation | Spatial sky 16325A emission deviations (filled: sky, open: star) | Spatial sky continuum emission | Spatial sky telluric CO2 absorption deviations (filled: H < 10) | |||||||||||||||||||||||
| 0 | 0 |
|
|
|
|
|
|
| IPAIR | NAME | SHIFT | NEWSHIFT | S/N | NAME | SHIFT | NEWSHIFT | S/N |
| 0 | 05480027 | 0.484528 | 0.00000 | 159.710 | 05480028 | 0.00130004 | 0.483228 | 157.512 |
| 1 | 05480031 | 0.483344 | 0.00118402 | 169.927 | 05480032 | -8.70865e-06 | 0.484537 | 167.726 |
| 2 | 05480030 | 0.480633 | 0.00389501 | 166.677 | 05480029 | 0.000153602 | 0.484374 | 165.135 |
| 3 | 05480026 | 0.481440 | 0.00308800 | 146.467 | 05480025 | 0.00000 | 0.484528 | 141.745 |