| Red | Green | Blue | |
| z | 17.64 | ||
| znorm | Inf | ||
| sky | -Inf | -Inf | -Inf |
| S/N | 26.0 | 45.4 | 48.0 |
| S/N(c) | 0.0 | 0.0 | 0.0 |
| SN(E/C) |
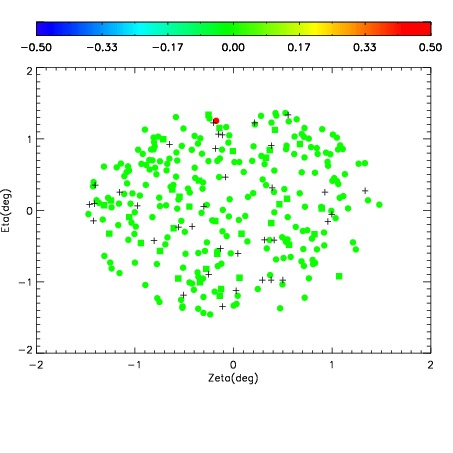
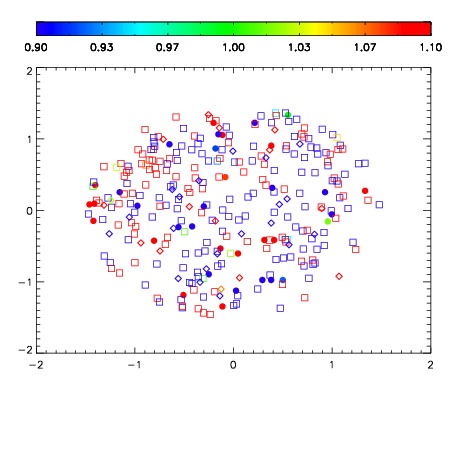
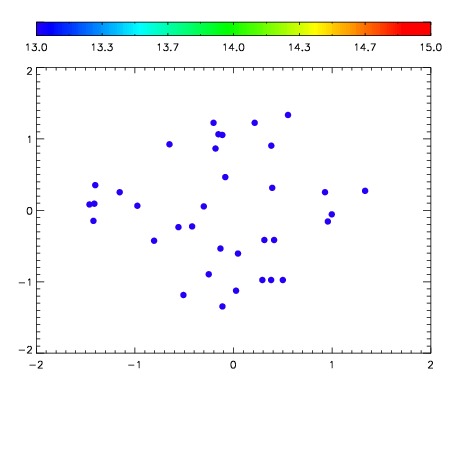

| Frame | Nreads | Zeropoints | Mag plots | Spatial mag deviation | Spatial sky 16325A emission deviations (filled: sky, open: star) | Spatial sky continuum emission | Spatial sky telluric CO2 absorption deviations (filled: H < 10) | |||||||||||||||||||||||
| 0 | 0 |
|
|
|
|
|
|
| IPAIR | NAME | SHIFT | NEWSHIFT | S/N | NAME | SHIFT | NEWSHIFT | S/N |
| 0 | 09990015 | 0.526101 | 0.00000 | 192.145 | 09990017 | 4.54746e-05 | 0.526056 | 196.668 |
| 1 | 09990019 | 0.524227 | 0.00187397 | 189.432 | 09990016 | 0.000218771 | 0.525882 | 194.023 |
| 2 | 09990018 | 0.524765 | 0.00133598 | 188.936 | 09990020 | 0.00366197 | 0.522439 | 188.371 |
| 3 | 09990014 | 0.526070 | 3.09944e-05 | 185.451 | 09990013 | 0.00000 | 0.526101 | 185.980 |