| Red | Green | Blue | |
| z | 17.64 | ||
| znorm | Inf | ||
| sky | -Inf | -Inf | -Inf |
| S/N | 22.6 | 38.6 | 39.9 |
| S/N(c) | 0.0 | 0.0 | 0.0 |
| SN(E/C) |
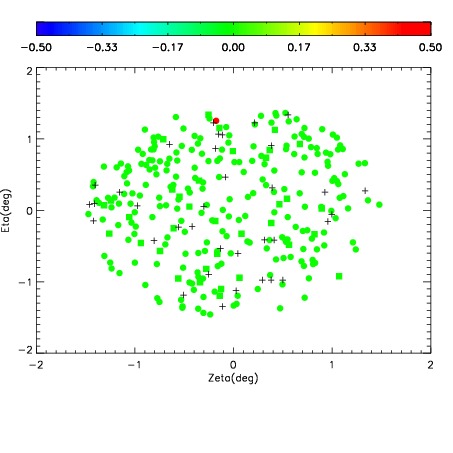
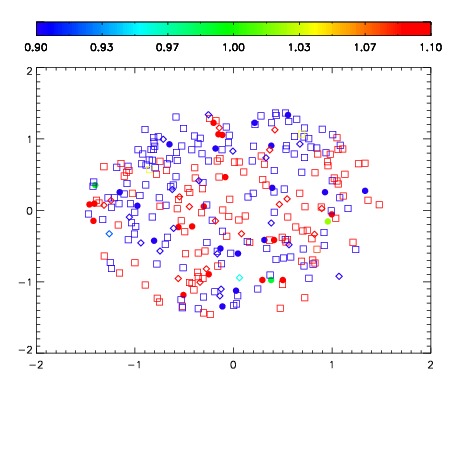
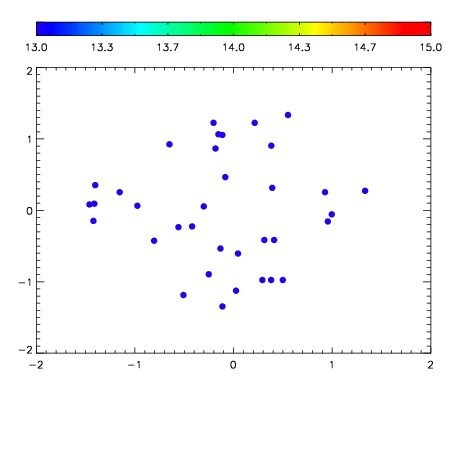

| Frame | Nreads | Zeropoints | Mag plots | Spatial mag deviation | Spatial sky 16325A emission deviations (filled: sky, open: star) | Spatial sky continuum emission | Spatial sky telluric CO2 absorption deviations (filled: H < 10) | |||||||||||||||||||||||
| 0 | 0 |
|
|
|
|
|
|
| IPAIR | NAME | SHIFT | NEWSHIFT | S/N | NAME | SHIFT | NEWSHIFT | S/N |
| 0 | 10030013 | 0.463560 | 0.00000 | 184.242 | 10030011 | 0.00000 | 0.463560 | 179.110 |
| 1 | 10030016 | 0.463297 | 0.000262976 | 190.618 | 10030015 | 6.52769e-05 | 0.463495 | 191.488 |
| 2 | 10030012 | 0.463093 | 0.000466973 | 185.584 | 10030014 | 0.000306544 | 0.463253 | 189.136 |