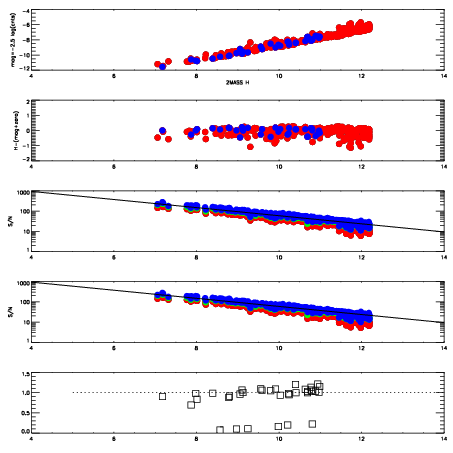
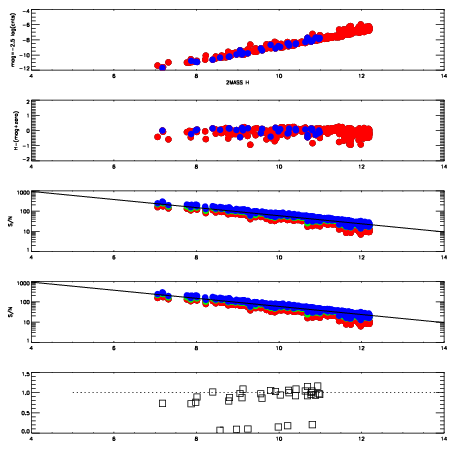
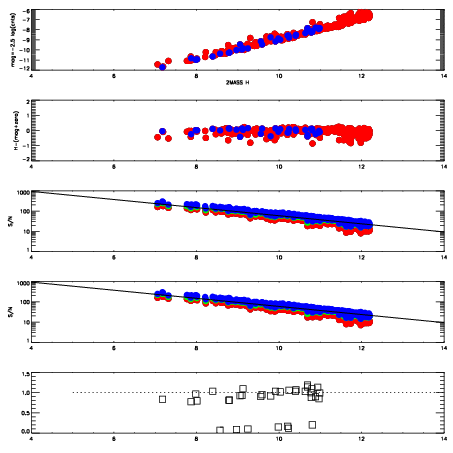
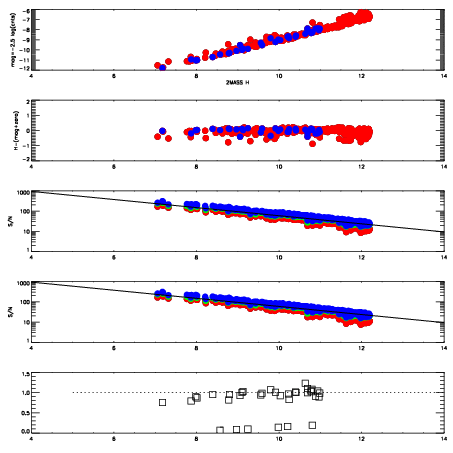
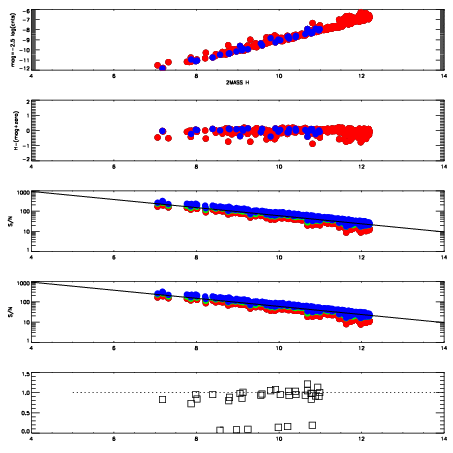
| Frame | Nreads | Zeropoints | Mag plots
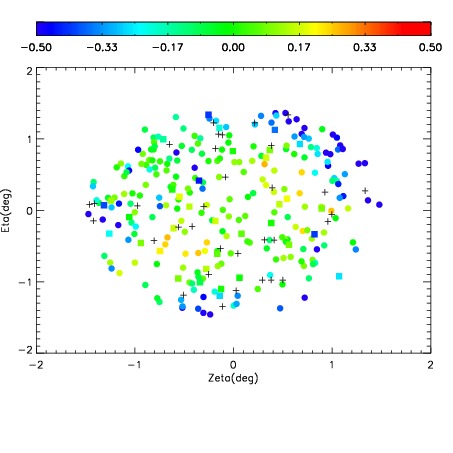
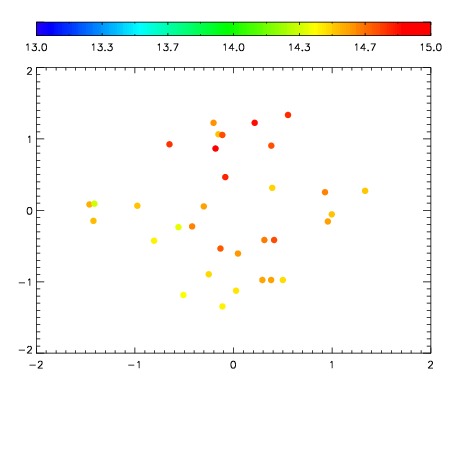
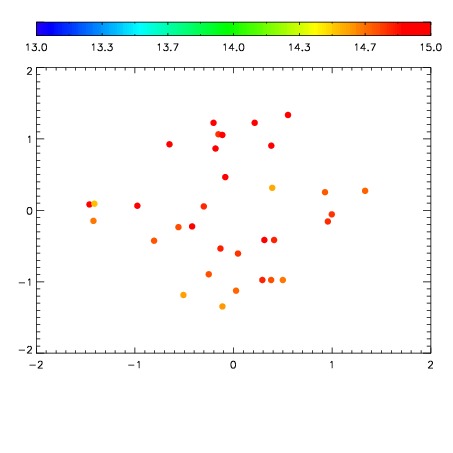
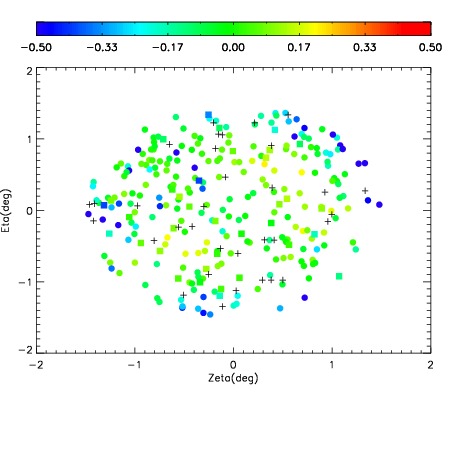
| Spatial mag deviation
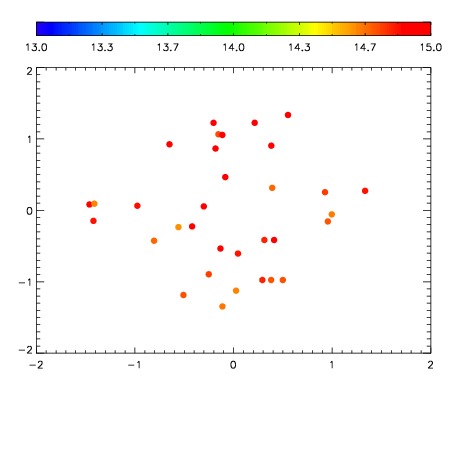
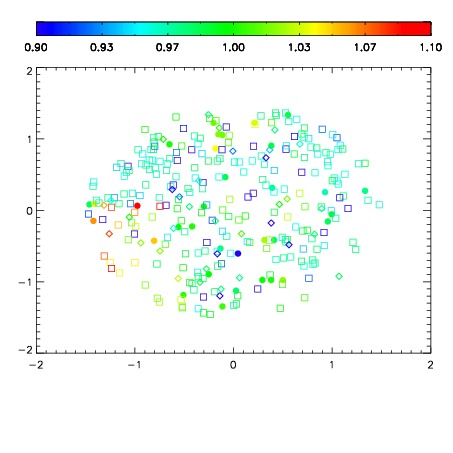
| Spatial sky 16325A emission deviations (filled: sky, open: star)
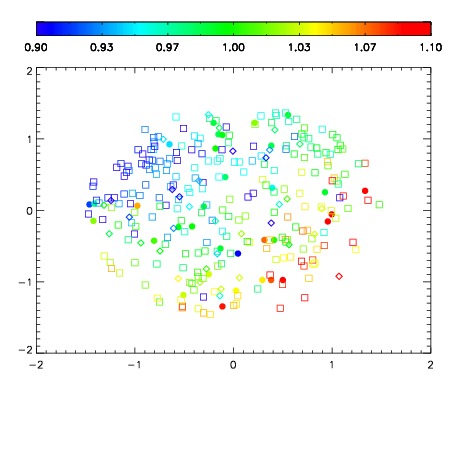
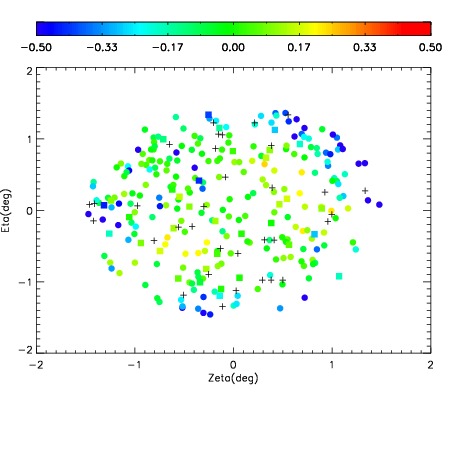
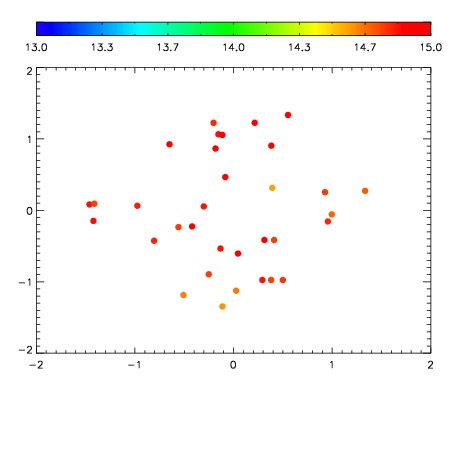
| Spatial sky continuum emission
| Spatial sky telluric CO2 absorption deviations (filled: H < 10)
|
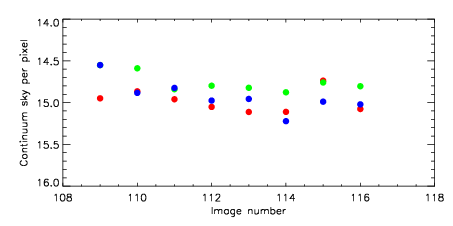
| 12100109
| 47
| | Red | Green | Blue
| | z | | 18.72
| | znorm | | 14.54
| | sky | 14.9 | 14.6 | 14.5
| | S/N | 11.7 | 19.8 | 21.1
| | S/N(c) | 10.1 | 18.7 | 19.9
| | SN(E/C) 0.99
|
| 
| 
| 
| 
| 
|
| 12100110
| 47
| | Red | Green | Blue
| | z | | 18.90
| | znorm | | 14.72
| | sky | 14.9 | 14.6 | 14.9
| | S/N | 13.1 | 21.4 | 23.9
| | S/N(c) | 11.6 | 20.3 | 22.5
| | SN(E/C) 0.94
|
| 
| 
| 
| 
| 
|
| 12100111
| 47
| | Red | Green | Blue
| | z | | 18.87
| | znorm | | 14.69
| | sky | 15.0 | 14.8 | 14.8
| | S/N | 12.8 | 21.6 | 23.8
| | S/N(c) | 11.0 | 20.1 | 22.2
| | SN(E/C) 0.94
|
| 
| 
| 
| 
| 
|
| 12100112
| 47
| | Red | Green | Blue
| | z | | 18.93
| | znorm | | 14.75
| | sky | 15.1 | 14.8 | 15.0
| | S/N | 13.4 | 22.7 | 24.4
| | S/N(c) | 12.0 | 21.2 | 23.2
| | SN(E/C) 0.92
|
| 
| 
| 
| 
| 
|
| 12100113
| 47
| | Red | Green | Blue
| | z | | 18.98
| | znorm | | 14.80
| | sky | 15.1 | 14.8 | 15.0
| | S/N | 13.7 | 23.3 | 25.0
| | S/N(c) | 12.3 | 21.7 | 23.8
| | SN(E/C) 0.93
|
| 
| 
| 
| 
| 
|
| 12100114
| 47
| | Red | Green | Blue
| | z | | 18.98
| | znorm | | 14.80
| | sky | 15.1 | 14.9 | 15.2
| | S/N | 13.8 | 23.4 | 25.4
| | S/N(c) | 12.1 | 21.6 | 23.9
| | SN(E/C) 0.95
|
| 
| 
| 
| 
| 
|
| 12100115
| 47
| | Red | Green | Blue
| | z | | 19.03
| | znorm | | 14.85
| | sky | 14.7 | 14.8 | 15.0
| | S/N | 14.1 | 24.0 | 25.6
| | S/N(c) | 12.5 | 22.4 | 24.2
| | SN(E/C) 0.93
|
| 
| 
| 
| 
| 
|
| 12100116
| 47
| | Red | Green | Blue
| | z | | 19.09
| | znorm | | 14.91
| | sky | 15.1 | 14.8 | 15.0
| | S/N | 14.7 | 24.5 | 26.5
| | S/N(c) | 13.2 | 22.8 | 25.3
| | SN(E/C) 0.93
|
| 
| 
| 
| 
| 
|