| Red | Green | Blue | |
| z | 17.64 | ||
| znorm | Inf | ||
| sky | -Inf | -Inf | -Inf |
| S/N | 23.9 | 42.3 | 46.7 |
| S/N(c) | 0.0 | 0.0 | 0.0 |
| SN(E/C) |
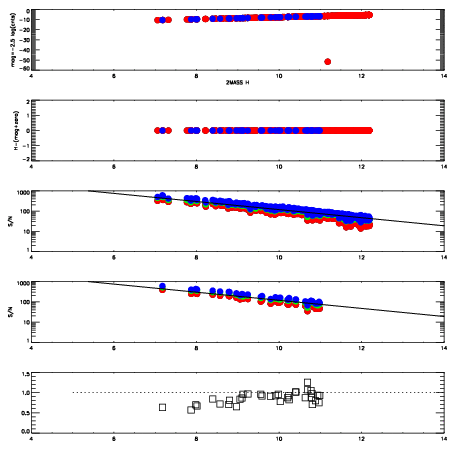
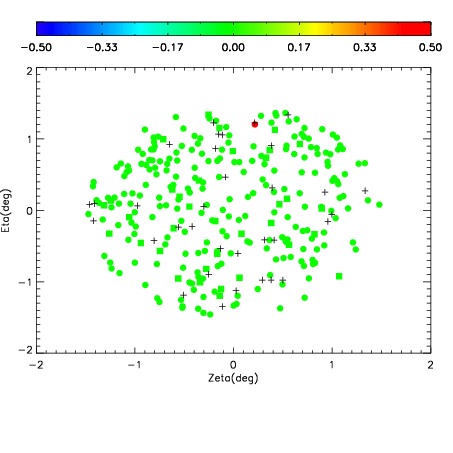
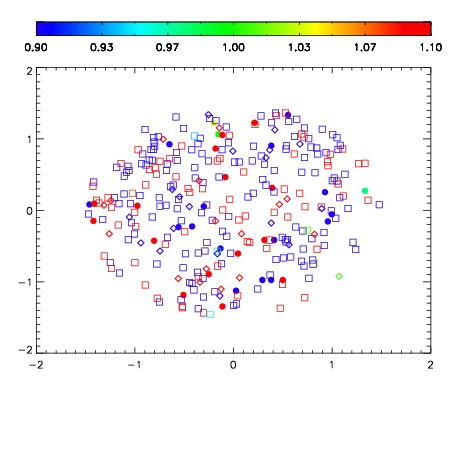
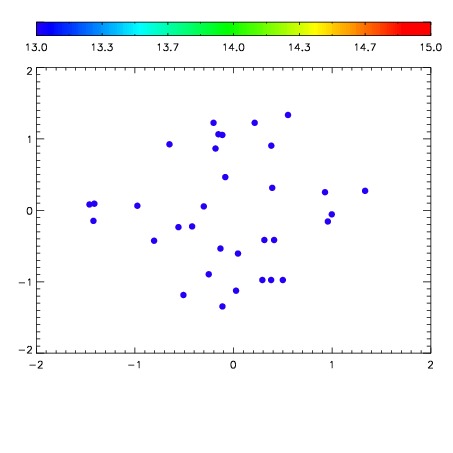

| Frame | Nreads | Zeropoints | Mag plots | Spatial mag deviation | Spatial sky 16325A emission deviations (filled: sky, open: star) | Spatial sky continuum emission | Spatial sky telluric CO2 absorption deviations (filled: H < 10) | |||||||||||||||||||||||
| 0 | 0 |
|
|
|
|
|
|
| IPAIR | NAME | SHIFT | NEWSHIFT | S/N | NAME | SHIFT | NEWSHIFT | S/N |
| 0 | 12100110 | 0.499417 | 0.00000 | 170.514 | 12100112 | -7.58169e-05 | 0.499493 | 174.130 |
| 1 | 12100115 | 0.498385 | 0.00103199 | 182.393 | 12100116 | -0.00120311 | 0.500620 | 195.798 |
| 2 | 12100114 | 0.497979 | 0.00143802 | 177.192 | 12100113 | -0.000356020 | 0.499773 | 177.460 |
| 3 | 12100111 | 0.498249 | 0.00116801 | 167.321 | 12100109 | 0.00000 | 0.499417 | 157.869 |