| Red | Green | Blue | |
| z | 17.64 | ||
| znorm | Inf | ||
| sky | -Inf | -NaN | -Inf |
| S/N | 20.3 | 35.6 | 38.5 |
| S/N(c) | 0.0 | 0.0 | 0.0 |
| SN(E/C) |
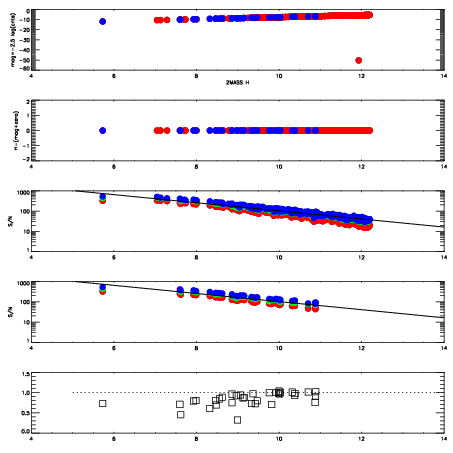
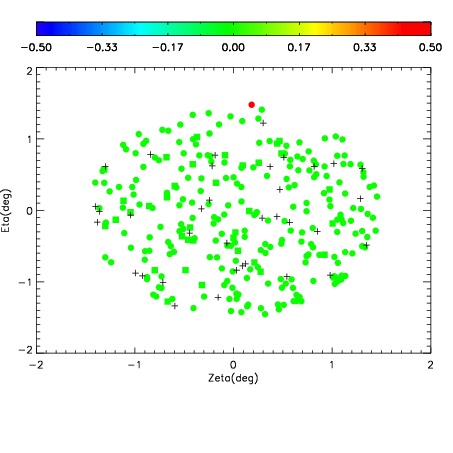
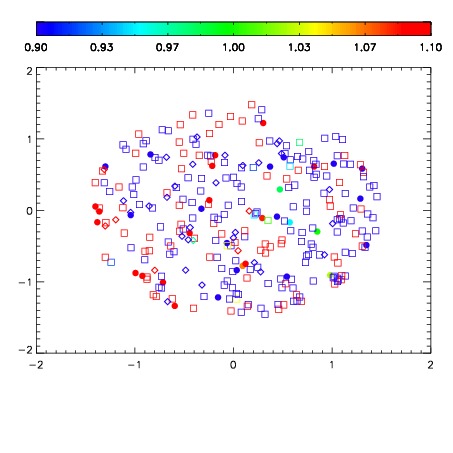
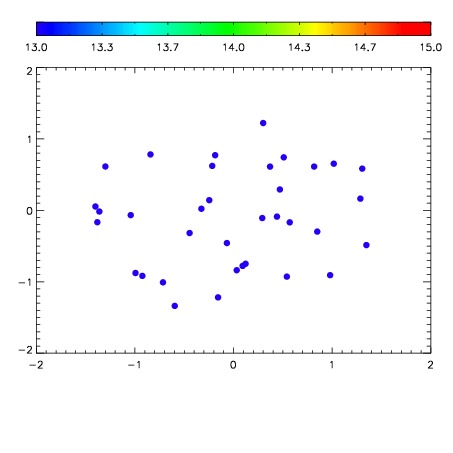

| Frame | Nreads | Zeropoints | Mag plots | Spatial mag deviation | Spatial sky 16325A emission deviations (filled: sky, open: star) | Spatial sky continuum emission | Spatial sky telluric CO2 absorption deviations (filled: H < 10) | |||||||||||||||||||||||
| 0 | 0 |
|
|
|
|
|
|
| IPAIR | NAME | SHIFT | NEWSHIFT | S/N | NAME | SHIFT | NEWSHIFT | S/N |
| 0 | 04870083 | 0.496144 | 0.00000 | 212.922 | 04870084 | 0.000338858 | 0.495805 | 220.703 |
| 1 | 04870086 | 0.495048 | 0.00109601 | 210.130 | 04870085 | 0.000819162 | 0.495325 | 207.941 |
| 2 | 04870082 | 0.495964 | 0.000180006 | 193.546 | 04870081 | 0.00000 | 0.496144 | 195.051 |