| Red | Green | Blue | |
| z | 17.64 | ||
| znorm | Inf | ||
| sky | -Inf | -Inf | -Inf |
| S/N | 27.3 | 46.8 | 49.4 |
| S/N(c) | 0.0 | 0.0 | 0.0 |
| SN(E/C) |
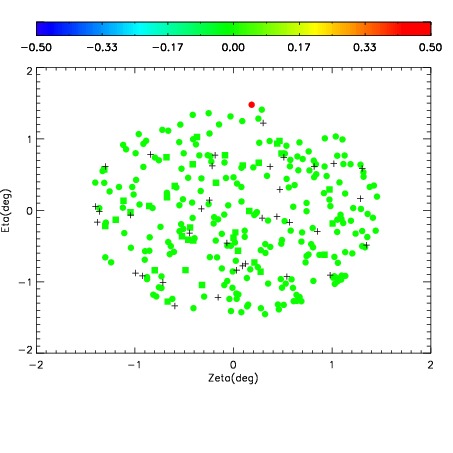
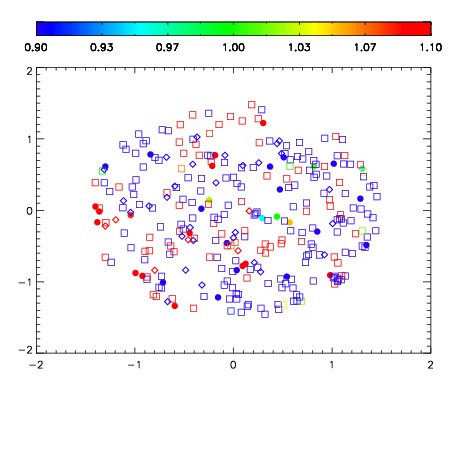
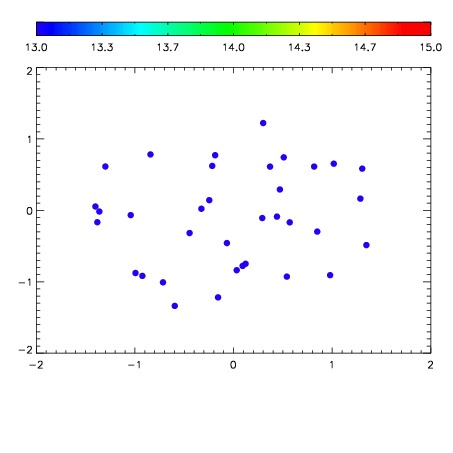

| Frame | Nreads | Zeropoints | Mag plots | Spatial mag deviation | Spatial sky 16325A emission deviations (filled: sky, open: star) | Spatial sky continuum emission | Spatial sky telluric CO2 absorption deviations (filled: H < 10) | |||||||||||||||||||||||
| 0 | 0 |
|
|
|
|
|
|
| IPAIR | NAME | SHIFT | NEWSHIFT | S/N | NAME | SHIFT | NEWSHIFT | S/N |
| 0 | 04910075 | 0.491412 | 0.00000 | 227.068 | 04910076 | 4.71605e-06 | 0.491407 | 230.541 |
| 1 | 04910070 | 0.486721 | 0.00469100 | 235.737 | 04910073 | -0.00277006 | 0.494182 | 233.748 |
| 2 | 04910071 | 0.487847 | 0.00356501 | 233.698 | 04910072 | -0.000478503 | 0.491891 | 233.720 |
| 3 | 04910074 | 0.486103 | 0.00530902 | 229.455 | 04910069 | 0.00000 | 0.491412 | 231.907 |