| Red | Green | Blue | |
| z | 17.64 | ||
| znorm | Inf | ||
| sky | -Inf | -Inf | -Inf |
| S/N | 24.6 | 41.2 | 44.5 |
| S/N(c) | 0.0 | 0.0 | 0.0 |
| SN(E/C) |
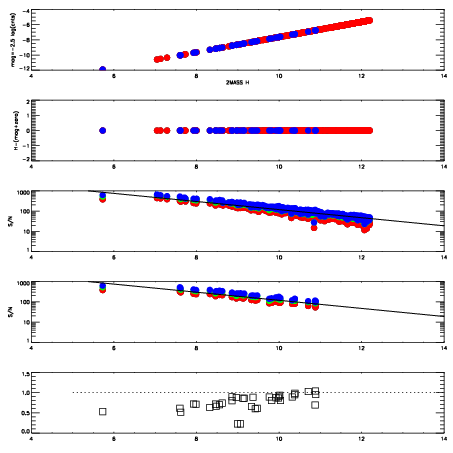
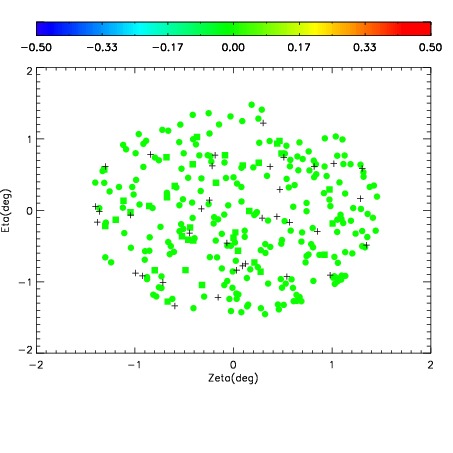
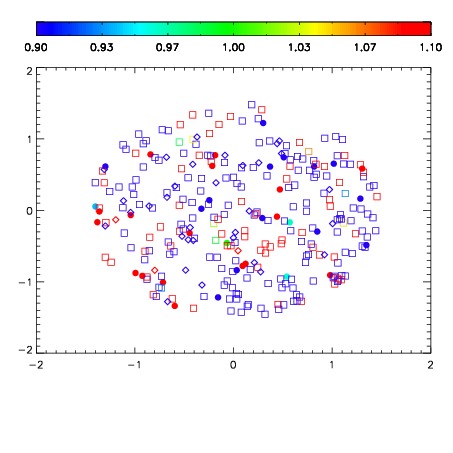
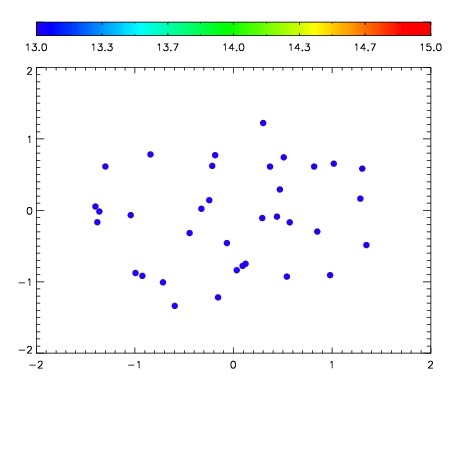

| Frame | Nreads | Zeropoints | Mag plots | Spatial mag deviation | Spatial sky 16325A emission deviations (filled: sky, open: star) | Spatial sky continuum emission | Spatial sky telluric CO2 absorption deviations (filled: H < 10) | |||||||||||||||||||||||
| 0 | 0 |
|
|
|
|
|
|
| IPAIR | NAME | SHIFT | NEWSHIFT | S/N | NAME | SHIFT | NEWSHIFT | S/N |
| 0 | 09040028 | 0.484151 | 0.00000 | 215.384 | 09040026 | 0.00344101 | 0.480710 | 222.110 |
| 1 | 09040023 | 0.479696 | 0.00445500 | 228.152 | 09040029 | 0.00433410 | 0.479817 | 230.148 |
| 2 | 09040027 | 0.483071 | 0.00108001 | 227.810 | 09040025 | 0.00291048 | 0.481241 | 227.276 |
| 3 | 09040024 | 0.479290 | 0.00486100 | 226.740 | 09040022 | 0.00000 | 0.484151 | 225.719 |