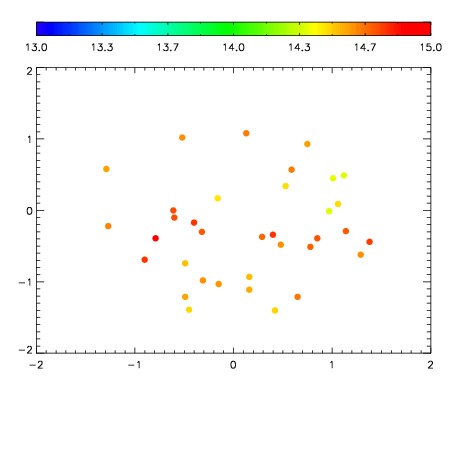
| Frame | Nreads | Zeropoints | Mag plots
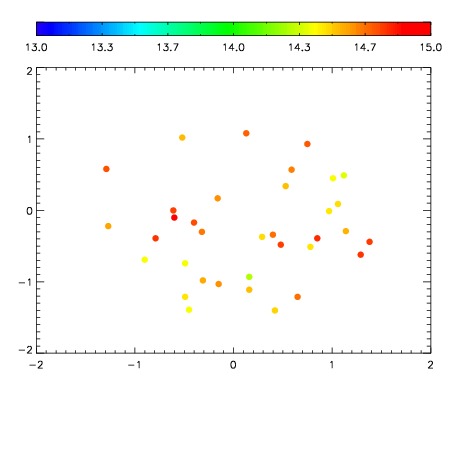
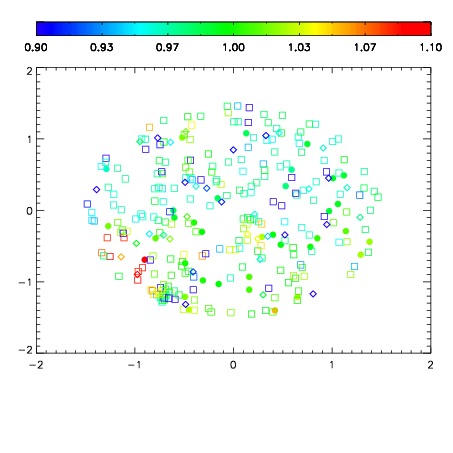
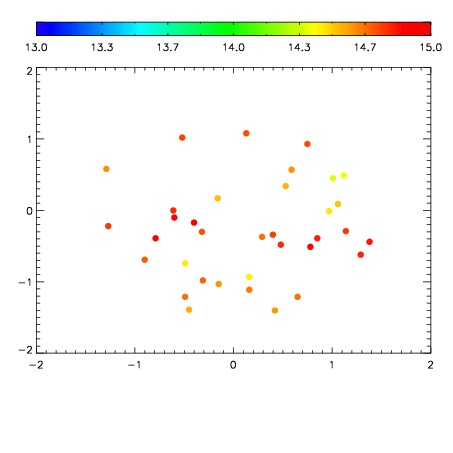
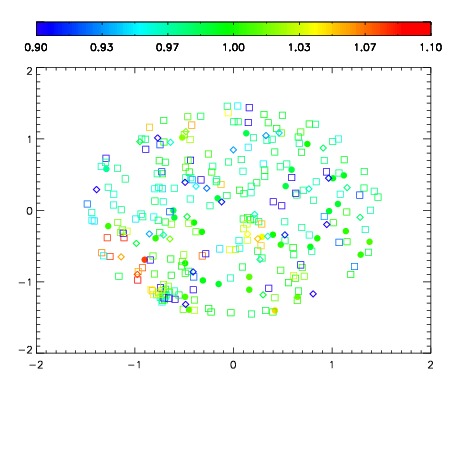
| Spatial mag deviation
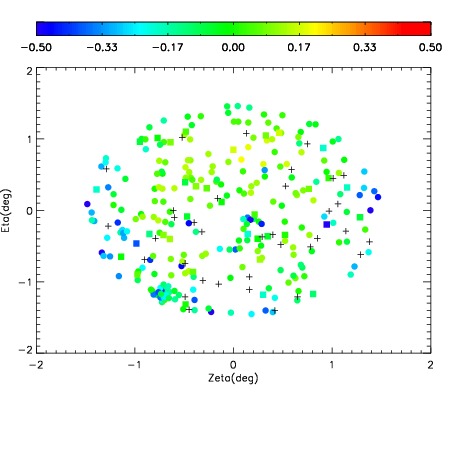
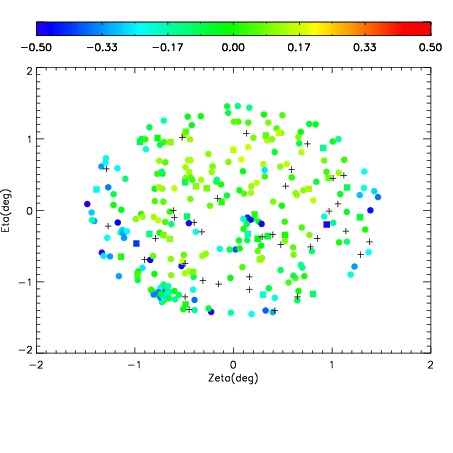
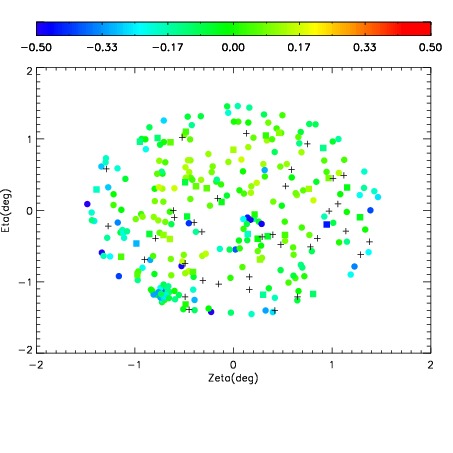
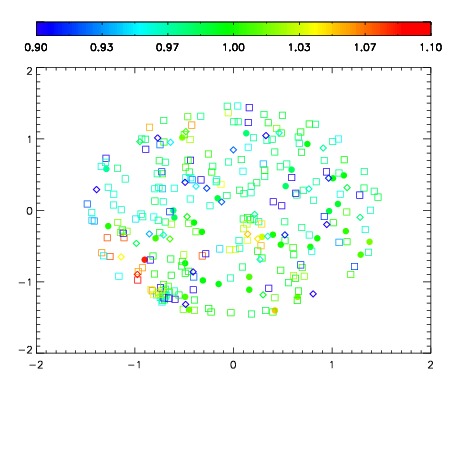
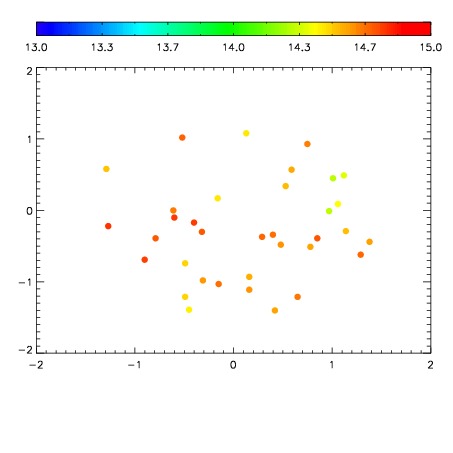
| Spatial sky 16325A emission deviations (filled: sky, open: star)
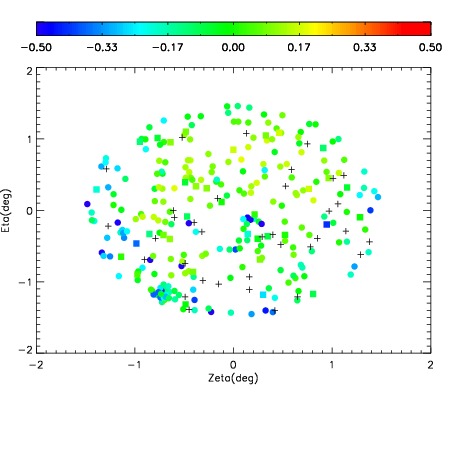
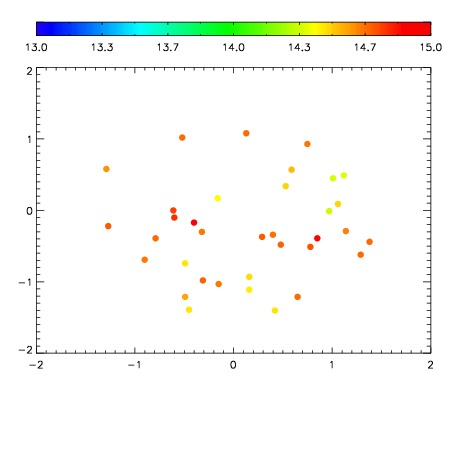
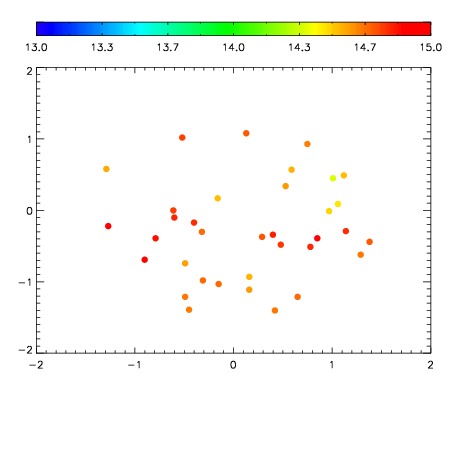
| Spatial sky continuum emission
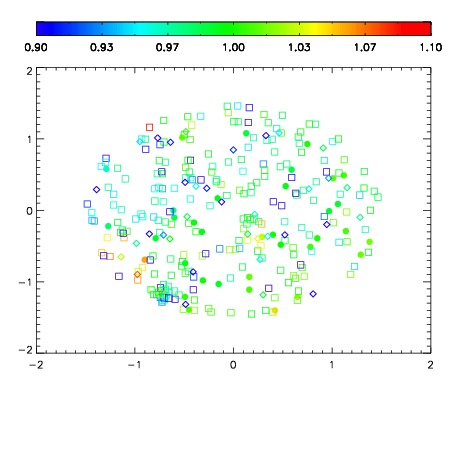
| Spatial sky telluric CO2 absorption deviations (filled: H < 10)
|
| 12060103
| 47
| | Red | Green | Blue
| | z | | 18.93
| | znorm | | 14.75
| | sky | 15.1 | 14.6 | 14.5
| | S/N | 15.1 | 24.7 | 26.7
| | S/N(c) | 13.5 | 23.7 | 25.1
| | SN(E/C) 0.93
|
| 
| 
| 
| 
| 
|
| 12060104
| 47
| | Red | Green | Blue
| | z | | 18.93
| | znorm | | 14.75
| | sky | 15.0 | 14.7 | 14.7
| | S/N | 15.1 | 24.5 | 26.4
| | S/N(c) | 13.3 | 23.3 | 25.2
| | SN(E/C) 0.90
|
| 
| 
| 
| 
| 
|
| 12060105
| 47
| | Red | Green | Blue
| | z | | 18.95
| | znorm | | 14.77
| | sky | 14.9 | 14.7 | 14.7
| | S/N | 15.4 | 25.3 | 26.6
| | S/N(c) | 13.8 | 24.0 | 25.2
| | SN(E/C) 0.92
|
| 
| 
| 
| 
| 
|
| 12060106
| 47
| | Red | Green | Blue
| | z | | 18.96
| | znorm | | 14.78
| | sky | 14.8 | 14.6 | 14.6
| | S/N | 15.2 | 25.1 | 26.4
| | S/N(c) | 13.6 | 23.7 | 25.3
| | SN(E/C) 0.90
|
| 
| 
| 
| 
| 
|
| 12060107
| 47
| | Red | Green | Blue
| | z | | 18.98
| | znorm | | 14.80
| | sky | 14.9 | 14.7 | 14.7
| | S/N | 15.9 | 26.1 | 27.5
| | S/N(c) | 14.1 | 24.3 | 25.7
| | SN(E/C) 0.96
|
| 
| 
| 
| 
| 
|
| 12060108
| 47
| | Red | Green | Blue
| | z | | 18.95
| | znorm | | 14.76
| | sky | 14.6 | 14.7 | 14.6
| | S/N | 15.0 | 24.8 | 25.9
| | S/N(c) | 13.2 | 23.3 | 25.0
| | SN(E/C) 0.92
|
| 
| 
| 
| 
| 
|
| 12060109
| 47
| | Red | Green | Blue
| | z | | 18.97
| | znorm | | 14.79
| | sky | 14.7 | 14.6 | 14.6
| | S/N | 16.0 | 26.1 | 27.2
| | S/N(c) | 14.0 | 24.0 | 25.7
| | SN(E/C) 0.98
|
| 
| 
| 
| 
| 
|
| 12060110
| 47
| | Red | Green | Blue
| | z | | 18.93
| | znorm | | 14.74
| | sky | 14.9 | 14.7 | 14.7
| | S/N | 15.2 | 25.2 | 26.0
| | S/N(c) | 13.2 | 23.3 | 24.6
| | SN(E/C) 0.95
|
| 
| 
| 
| 
| 
|