| Red | Green | Blue | |
| z | 17.64 | ||
| znorm | Inf | ||
| sky | -Inf | -Inf | -Inf |
| S/N | 27.4 | 47.9 | 50.6 |
| S/N(c) | 0.0 | 0.0 | 0.0 |
| SN(E/C) |
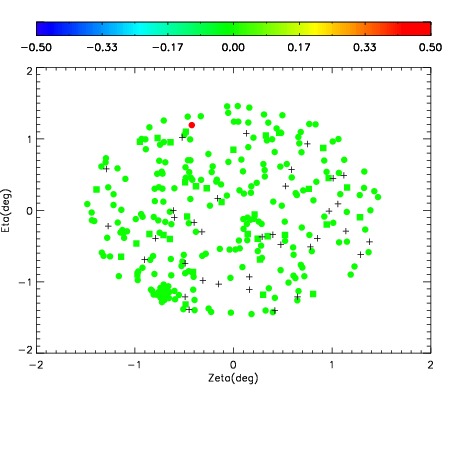
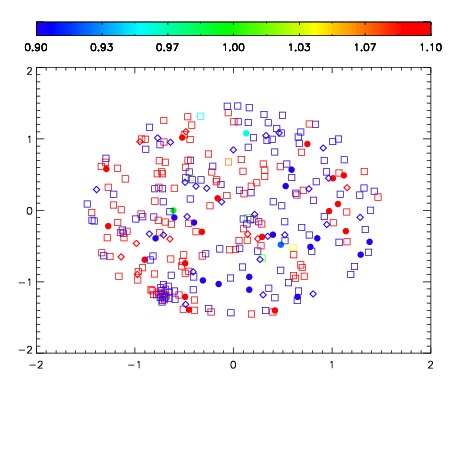
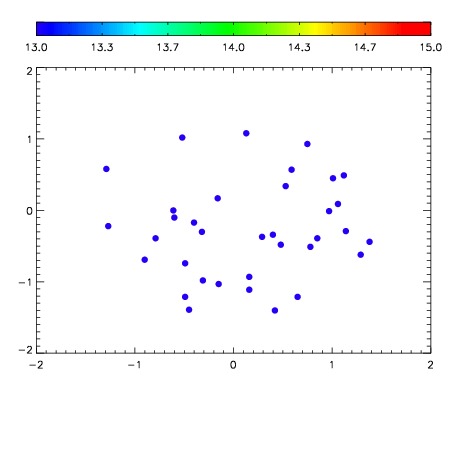

| Frame | Nreads | Zeropoints | Mag plots | Spatial mag deviation | Spatial sky 16325A emission deviations (filled: sky, open: star) | Spatial sky continuum emission | Spatial sky telluric CO2 absorption deviations (filled: H < 10) | |||||||||||||||||||||||
| 0 | 0 |
|
|
|
|
|
|
| IPAIR | NAME | SHIFT | NEWSHIFT | S/N | NAME | SHIFT | NEWSHIFT | S/N |
| 0 | 12060109 | 0.503074 | 0.00000 | 166.577 | 12060107 | -0.00128955 | 0.504364 | 163.142 |
| 1 | 12060108 | 0.502444 | 0.000629961 | 153.128 | 12060110 | 0.000599078 | 0.502475 | 162.102 |
| 2 | 12060105 | 0.502922 | 0.000151992 | 152.275 | 12060106 | -0.00168675 | 0.504761 | 156.737 |
| 3 | 12060104 | 0.502512 | 0.000562012 | 150.780 | 12060103 | 0.00000 | 0.503074 | 151.325 |