| Red | Green | Blue | |
| z | 17.64 | ||
| znorm | Inf | ||
| sky | -Inf | -Inf | -Inf |
| S/N | 22.9 | 39.7 | 44.7 |
| S/N(c) | 0.0 | 0.0 | 0.0 |
| SN(E/C) |
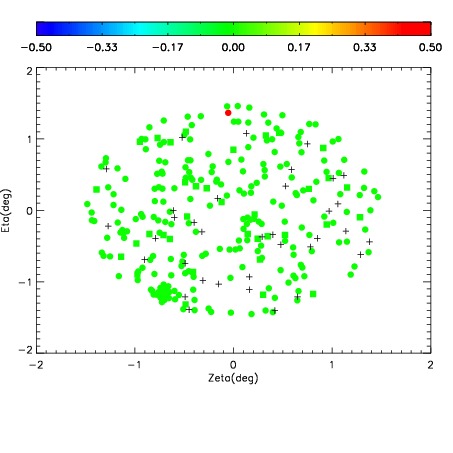

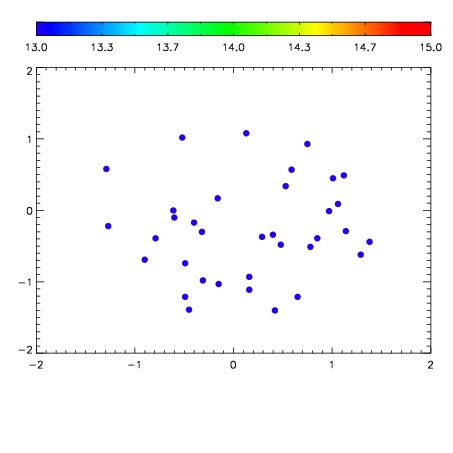

| Frame | Nreads | Zeropoints | Mag plots | Spatial mag deviation | Spatial sky 16325A emission deviations (filled: sky, open: star) | Spatial sky continuum emission | Spatial sky telluric CO2 absorption deviations (filled: H < 10) | |||||||||||||||||||||||
| 0 | 0 |
|
|
|
|
|
|
| IPAIR | NAME | SHIFT | NEWSHIFT | S/N | NAME | SHIFT | NEWSHIFT | S/N |
| 0 | 12110039 | 0.494998 | 0.00000 | 139.339 | 12110033 | 0.00000 | 0.494998 | 140.852 |
| 1 | 12110038 | 0.494694 | 0.000304013 | 156.372 | 12110040 | -0.000946650 | 0.495945 | 168.763 |
| 2 | 12110035 | 0.494516 | 0.000482023 | 151.110 | 12110037 | -0.00163462 | 0.496633 | 154.079 |
| 3 | 12110034 | 0.494652 | 0.000346005 | 143.394 | 12110036 | -0.00135047 | 0.496348 | 146.759 |