| Red | Green | Blue | |
| z | 17.64 | ||
| znorm | Inf | ||
| sky | -Inf | -Inf | -Inf |
| S/N | 26.7 | 44.1 | 48.5 |
| S/N(c) | 0.0 | 0.0 | 0.0 |
| SN(E/C) |
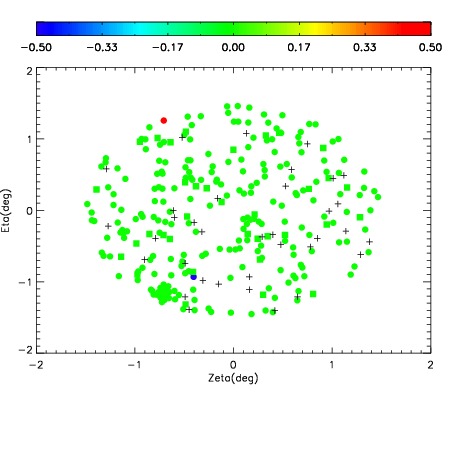
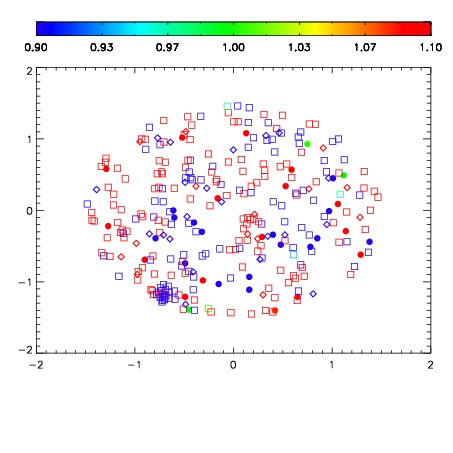
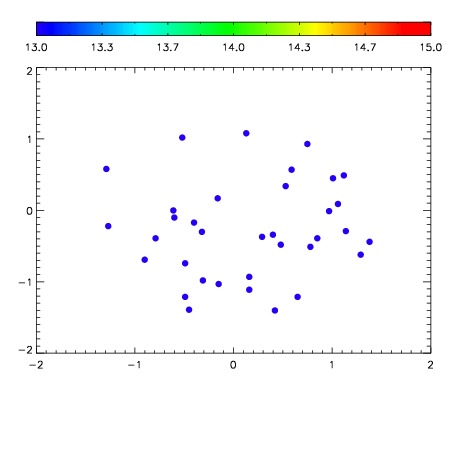

| Frame | Nreads | Zeropoints | Mag plots | Spatial mag deviation | Spatial sky 16325A emission deviations (filled: sky, open: star) | Spatial sky continuum emission | Spatial sky telluric CO2 absorption deviations (filled: H < 10) | |||||||||||||||||||||||
| 0 | 0 |
|
|
|
|
|
|
| IPAIR | NAME | SHIFT | NEWSHIFT | S/N | NAME | SHIFT | NEWSHIFT | S/N |
| 0 | 12400032 | 0.496074 | 0.00000 | 173.443 | 12400033 | -0.00108439 | 0.497158 | 178.368 |
| 1 | 12400031 | 0.496048 | 2.59876e-05 | 170.065 | 12400030 | -0.00200451 | 0.498078 | 167.847 |
| 2 | 12400028 | 0.494317 | 0.00175700 | 150.710 | 12400026 | 0.00000 | 0.496074 | 159.383 |
| 3 | 12400027 | 0.495034 | 0.00103998 | 147.580 | 12400029 | -0.00222719 | 0.498301 | 158.646 |