| Red | Green | Blue | |
| z | 17.64 | ||
| znorm | Inf | ||
| sky | -Inf | -Inf | -Inf |
| S/N | 18.3 | 34.2 | 35.5 |
| S/N(c) | 0.0 | 0.0 | 0.0 |
| SN(E/C) |
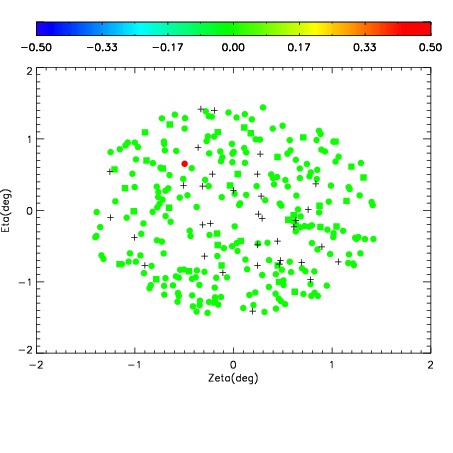
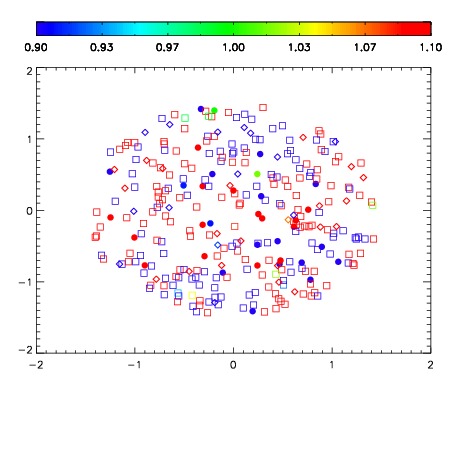
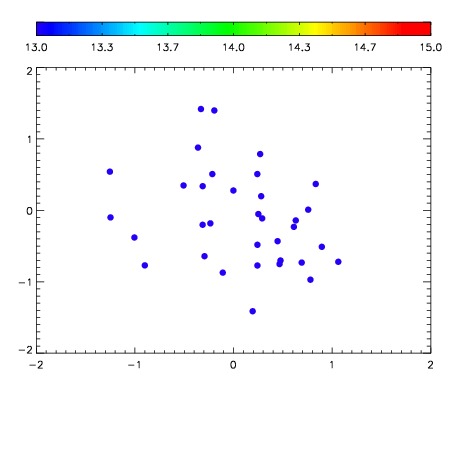

| Frame | Nreads | Zeropoints | Mag plots | Spatial mag deviation | Spatial sky 16325A emission deviations (filled: sky, open: star) | Spatial sky continuum emission | Spatial sky telluric CO2 absorption deviations (filled: H < 10) | |||||||||||||||||||||||
| 0 | 0 |
|
|
|
|
|
|
| IPAIR | NAME | SHIFT | NEWSHIFT | S/N | NAME | SHIFT | NEWSHIFT | S/N |
| 0 | 12110023 | 0.496241 | 0.00000 | 108.503 | 12110022 | 0.00000 | 0.496241 | 75.6020 |
| 1 | 12110027 | 0.495756 | 0.000485003 | 156.894 | 12110025 | -0.00167280 | 0.497914 | 160.811 |
| 2 | 12110024 | 0.496174 | 6.69956e-05 | 144.047 | 12110029 | -0.00290648 | 0.499147 | 155.173 |
| 3 | 12110028 | 0.495649 | 0.000591993 | 139.784 | 12110026 | -0.00129993 | 0.497541 | 149.092 |