| Red | Green | Blue | |
| z | 17.64 | ||
| znorm | Inf | ||
| sky | -Inf | -Inf | -Inf |
| S/N | 24.7 | 42.2 | 46.1 |
| S/N(c) | 0.0 | 0.0 | 0.0 |
| SN(E/C) |
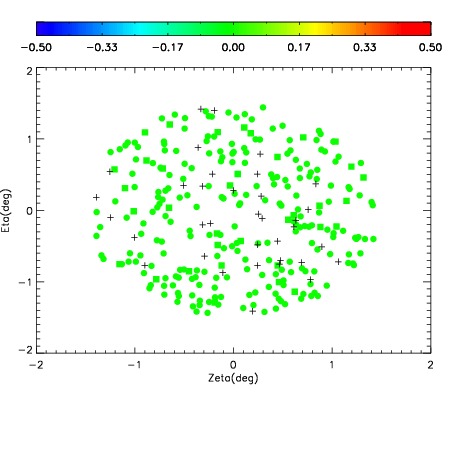
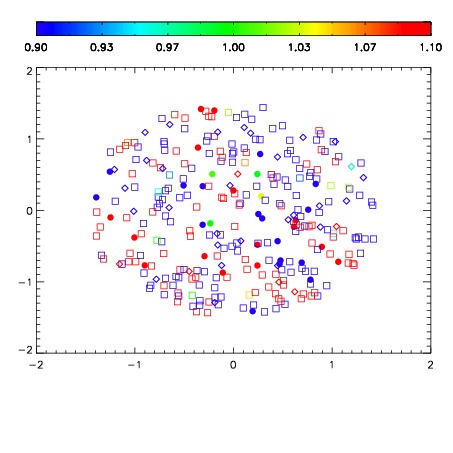
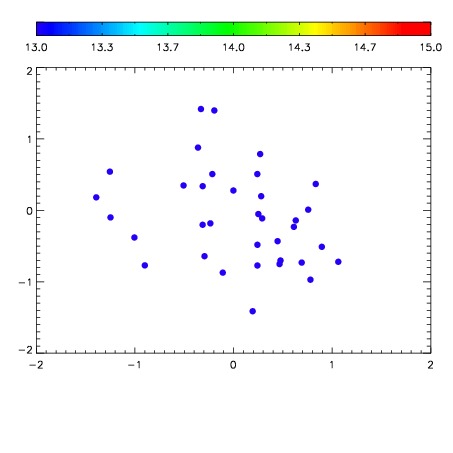

| Frame | Nreads | Zeropoints | Mag plots | Spatial mag deviation | Spatial sky 16325A emission deviations (filled: sky, open: star) | Spatial sky continuum emission | Spatial sky telluric CO2 absorption deviations (filled: H < 10) | |||||||||||||||||||||||
| 0 | 0 |
|
|
|
|
|
|
| IPAIR | NAME | SHIFT | NEWSHIFT | S/N | NAME | SHIFT | NEWSHIFT | S/N |
| 0 | 12440039 | 0.490105 | 0.00000 | 191.060 | 12440040 | 0.00232461 | 0.487780 | 193.883 |
| 1 | 12440038 | 0.489118 | 0.000986993 | 197.055 | 12440036 | -0.000998393 | 0.491103 | 198.964 |
| 2 | 12440035 | 0.488261 | 0.00184399 | 196.229 | 12440037 | -0.000673166 | 0.490778 | 197.233 |
| 3 | 12440034 | 0.487520 | 0.00258499 | 186.964 | 12440033 | 0.00000 | 0.490105 | 192.025 |