| Red | Green | Blue | |
| z | 17.64 | ||
| znorm | Inf | ||
| sky | -Inf | -Inf | -Inf |
| S/N | 25.6 | 44.2 | 48.2 |
| S/N(c) | 0.0 | 0.0 | 0.0 |
| SN(E/C) |
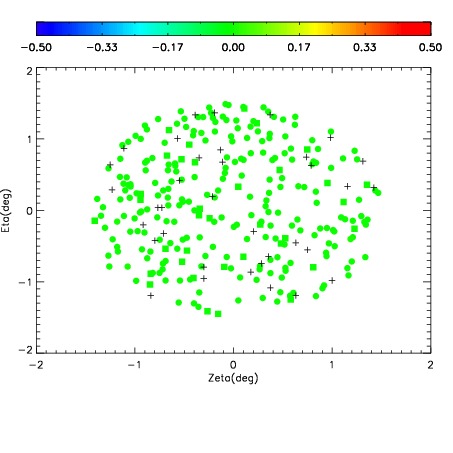
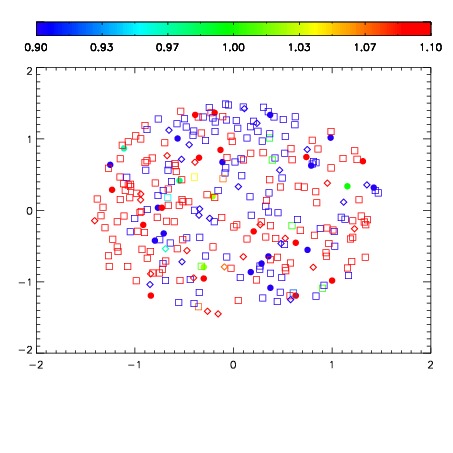
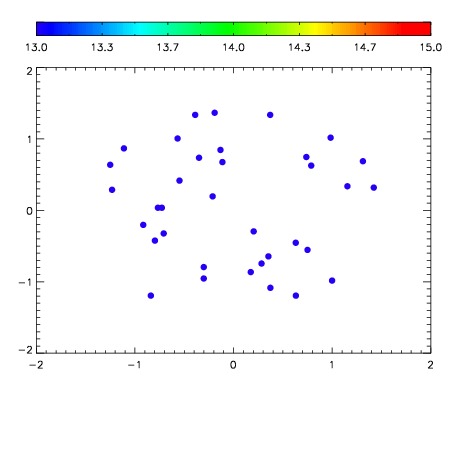

| Frame | Nreads | Zeropoints | Mag plots | Spatial mag deviation | Spatial sky 16325A emission deviations (filled: sky, open: star) | Spatial sky continuum emission | Spatial sky telluric CO2 absorption deviations (filled: H < 10) | |||||||||||||||||||||||
| 0 | 0 |
|
|
|
|
|
|
| IPAIR | NAME | SHIFT | NEWSHIFT | S/N | NAME | SHIFT | NEWSHIFT | S/N |
| 0 | 12430039 | 0.492576 | 0.00000 | 219.540 | 12430036 | -0.000483376 | 0.493059 | 217.310 |
| 1 | 12430035 | 0.492106 | 0.000470012 | 217.690 | 12430037 | -0.000878335 | 0.493454 | 215.684 |
| 2 | 12430034 | 0.490925 | 0.00165099 | 213.371 | 12430040 | -0.00166897 | 0.494245 | 211.987 |
| 3 | 12430038 | 0.491936 | 0.000640005 | 211.384 | 12430033 | 0.00000 | 0.492576 | 204.255 |