| Red | Green | Blue | |
| z | 17.64 | ||
| znorm | Inf | ||
| sky | -Inf | -Inf | -Inf |
| S/N | 24.5 | 41.2 | 48.1 |
| S/N(c) | 0.0 | 0.0 | 0.0 |
| SN(E/C) |
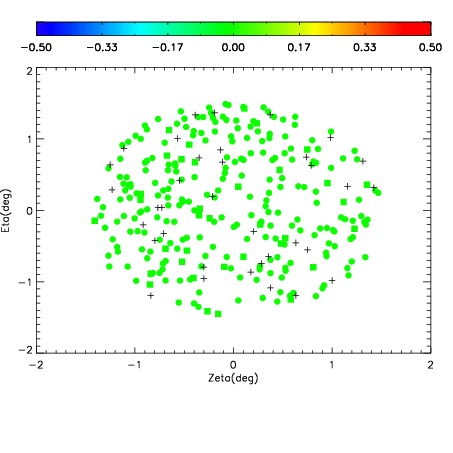
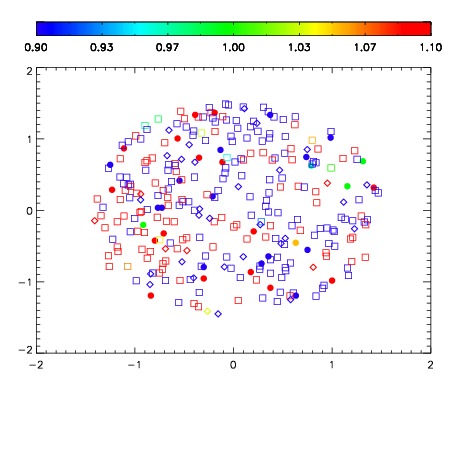
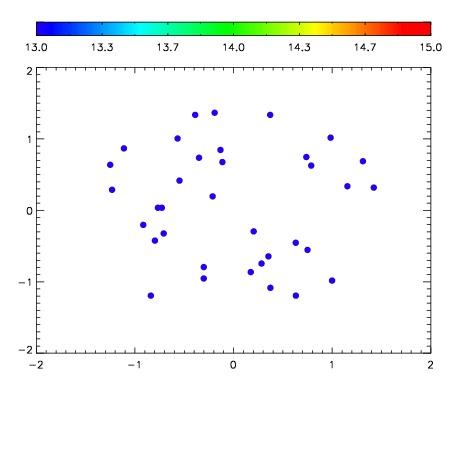

| Frame | Nreads | Zeropoints | Mag plots | Spatial mag deviation | Spatial sky 16325A emission deviations (filled: sky, open: star) | Spatial sky continuum emission | Spatial sky telluric CO2 absorption deviations (filled: H < 10) | |||||||||||||||||||||||
| 0 | 0 |
|
|
|
|
|
|
| IPAIR | NAME | SHIFT | NEWSHIFT | S/N | NAME | SHIFT | NEWSHIFT | S/N |
| 0 | 12470038 | 0.488583 | 0.00000 | 213.067 | 12470036 | -0.000620673 | 0.489204 | 213.209 |
| 1 | 12470035 | 0.487549 | 0.00103399 | 208.248 | 12470037 | -0.000145828 | 0.488729 | 212.014 |
| 2 | 12470034 | 0.487042 | 0.00154099 | 205.568 | 12470033 | 0.00000 | 0.488583 | 205.713 |