| Red | Green | Blue | |
| z | 17.64 | ||
| znorm | Inf | ||
| sky | -Inf | -Inf | -Inf |
| S/N | 23.9 | 42.1 | 45.0 |
| S/N(c) | 0.0 | 0.0 | 0.0 |
| SN(E/C) |

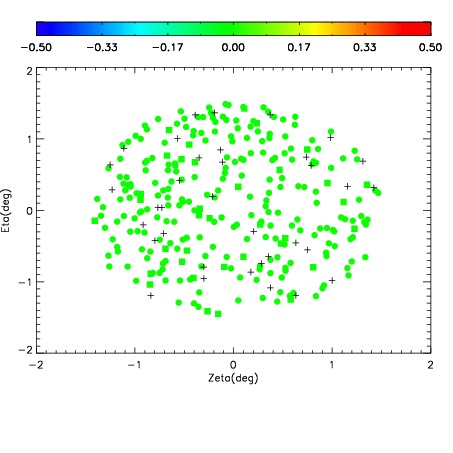


| Frame | Nreads | Zeropoints | Mag plots | Spatial mag deviation | Spatial sky 16325A emission deviations (filled: sky, open: star) | Spatial sky continuum emission | Spatial sky telluric CO2 absorption deviations (filled: H < 10) | |||||||||||||||||||||||
| 0 | 0 |
|
|
|
|
|
|
| IPAIR | NAME | SHIFT | NEWSHIFT | S/N | NAME | SHIFT | NEWSHIFT | S/N |
| 0 | 12510022 | 0.492384 | 0.00000 | 176.547 | 12510020 | 0.00000 | 0.492384 | 170.199 |
| 1 | 12510026 | 0.490991 | 0.00139299 | 186.006 | 12510027 | 0.000160776 | 0.492223 | 189.289 |
| 2 | 12510025 | 0.490712 | 0.00167200 | 184.784 | 12510024 | -0.00134547 | 0.493729 | 188.153 |
| 3 | 12510021 | 0.491594 | 0.000790000 | 176.683 | 12510023 | -0.00198720 | 0.494371 | 180.537 |