| Red | Green | Blue | |
| z | 17.64 | ||
| znorm | Inf | ||
| sky | -Inf | -NaN | -Inf |
| S/N | 26.9 | 45.5 | 49.7 |
| S/N(c) | 0.0 | 0.0 | 0.0 |
| SN(E/C) |
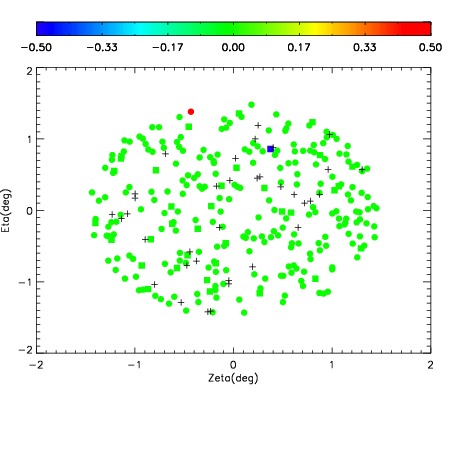
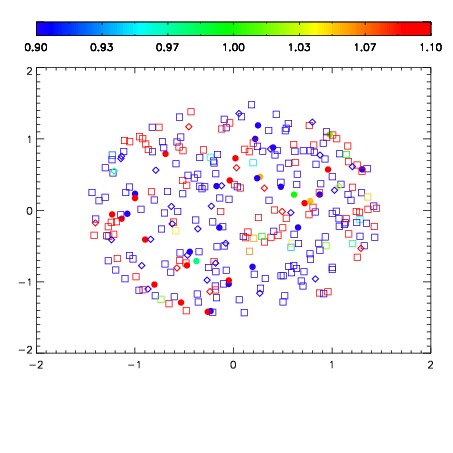
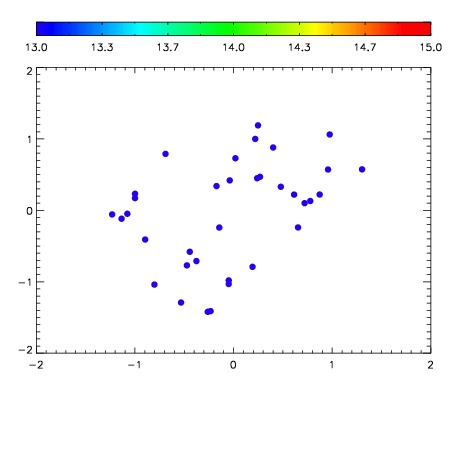

| Frame | Nreads | Zeropoints | Mag plots | Spatial mag deviation | Spatial sky 16325A emission deviations (filled: sky, open: star) | Spatial sky continuum emission | Spatial sky telluric CO2 absorption deviations (filled: H < 10) | |||||||||||||||||||||||
| 0 | 0 |
|
|
|
|
|
|
| IPAIR | NAME | SHIFT | NEWSHIFT | S/N | NAME | SHIFT | NEWSHIFT | S/N |
| 0 | 05180046 | 0.494975 | 0.00000 | 183.682 | 05180048 | -0.00192284 | 0.496898 | 186.812 |
| 1 | 05180050 | 0.491320 | 0.00365499 | 200.027 | 05180051 | -0.00189590 | 0.496871 | 193.520 |
| 2 | 05180049 | 0.491882 | 0.00309300 | 186.956 | 05180047 | 2.51099e-05 | 0.494950 | 189.961 |
| 3 | 05180045 | 0.493225 | 0.00174999 | 175.385 | 05180044 | 0.00000 | 0.494975 | 167.048 |