| Red | Green | Blue | |
| z | 17.64 | ||
| znorm | Inf | ||
| sky | -Inf | -Inf | -Inf |
| S/N | 27.9 | 45.6 | 50.5 |
| S/N(c) | 0.0 | 0.0 | 0.0 |
| SN(E/C) |

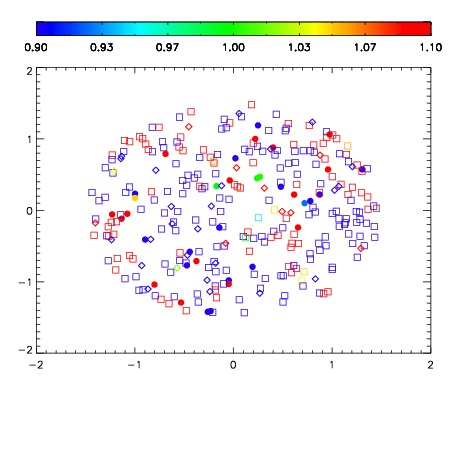
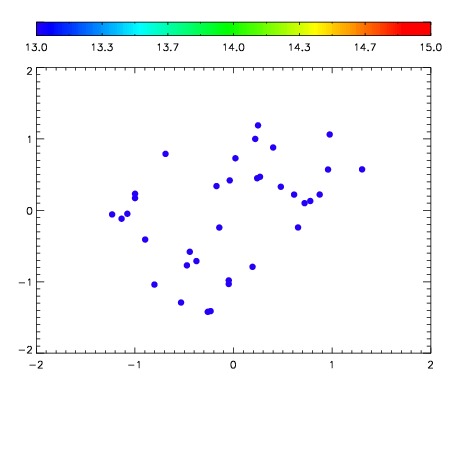

| Frame | Nreads | Zeropoints | Mag plots | Spatial mag deviation | Spatial sky 16325A emission deviations (filled: sky, open: star) | Spatial sky continuum emission | Spatial sky telluric CO2 absorption deviations (filled: H < 10) | |||||||||||||||||||||||
| 0 | 0 |
|
|
|
|
|
|
| IPAIR | NAME | SHIFT | NEWSHIFT | S/N | NAME | SHIFT | NEWSHIFT | S/N |
| 0 | 11780028 | 0.488222 | 0.00000 | 162.850 | 11780029 | -0.00207382 | 0.490296 | 164.505 |
| 1 | 11780032 | 0.487071 | 0.00115100 | 177.471 | 11780033 | -0.00228025 | 0.490502 | 177.803 |
| 2 | 11780031 | 0.487382 | 0.000840008 | 168.227 | 11780030 | -0.00170692 | 0.489929 | 169.872 |
| 3 | 11780027 | 0.487556 | 0.000665992 | 159.061 | 11780026 | 0.00000 | 0.488222 | 139.880 |