| Red | Green | Blue | |
| z | 17.64 | ||
| znorm | Inf | ||
| sky | -Inf | -NaN | -NaN |
| S/N | 29.5 | 51.1 | 54.8 |
| S/N(c) | 0.0 | 0.0 | 0.0 |
| SN(E/C) |
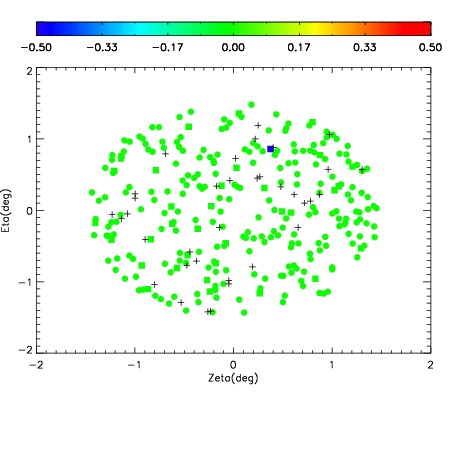
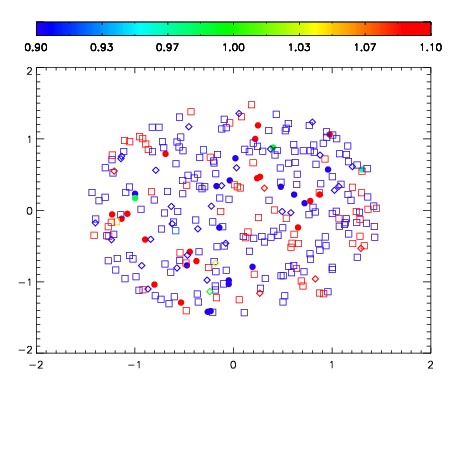
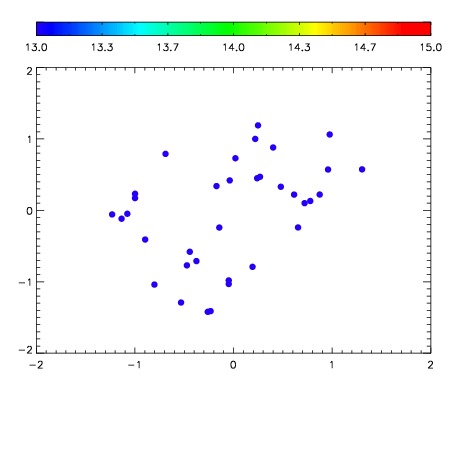

| Frame | Nreads | Zeropoints | Mag plots | Spatial mag deviation | Spatial sky 16325A emission deviations (filled: sky, open: star) | Spatial sky continuum emission | Spatial sky telluric CO2 absorption deviations (filled: H < 10) | |||||||||||||||||||||||
| 0 | 0 |
|
|
|
|
|
|
| IPAIR | NAME | SHIFT | NEWSHIFT | S/N | NAME | SHIFT | NEWSHIFT | S/N |
| 0 | 11860077 | 0.491515 | 0.00000 | 162.462 | 11860076 | 0.00000 | 0.491515 | 145.792 |
| 1 | 11860085 | 0.488476 | 0.00303900 | 185.914 | 11860083 | -0.00366056 | 0.495176 | 186.268 |
| 2 | 11860082 | 0.489021 | 0.00249401 | 181.290 | 11860080 | -0.00349263 | 0.495008 | 178.170 |
| 3 | 11860081 | 0.489330 | 0.00218502 | 178.797 | 11860079 | -0.00345216 | 0.494967 | 175.694 |
| 4 | 11860078 | 0.491407 | 0.000108004 | 174.615 | 11860084 | -0.00359330 | 0.495108 | 172.500 |