| Red | Green | Blue | |
| z | 17.64 | ||
| znorm | Inf | ||
| sky | -Inf | -Inf | -Inf |
| S/N | 26.2 | 45.1 | 50.5 |
| S/N(c) | 0.0 | 0.0 | 0.0 |
| SN(E/C) |
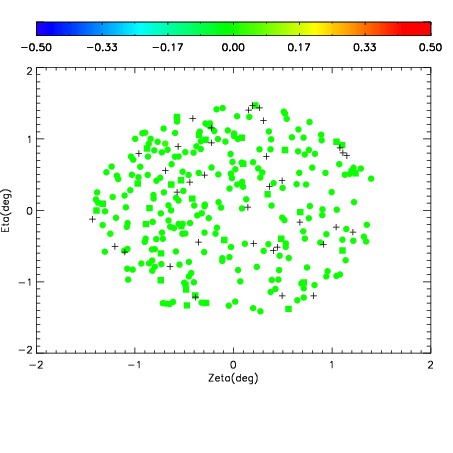
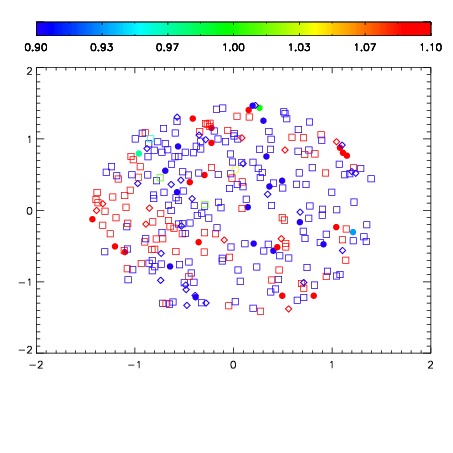
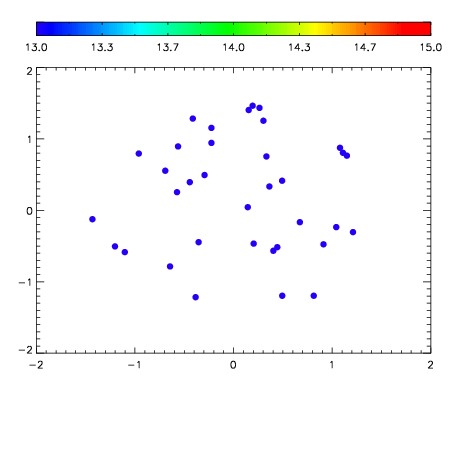

| Frame | Nreads | Zeropoints | Mag plots | Spatial mag deviation | Spatial sky 16325A emission deviations (filled: sky, open: star) | Spatial sky continuum emission | Spatial sky telluric CO2 absorption deviations (filled: H < 10) | |||||||||||||||||||||||
| 0 | 0 |
|
|
|
|
|
|
| IPAIR | NAME | SHIFT | NEWSHIFT | S/N | NAME | SHIFT | NEWSHIFT | S/N |
| 0 | 09060050 | 0.478673 | 0.00000 | 217.046 | 09060044 | 0.00000 | 0.478673 | 216.363 |
| 1 | 09060045 | 0.477957 | 0.000716001 | 217.548 | 09060048 | 0.000998648 | 0.477674 | 216.644 |
| 2 | 09060046 | 0.477969 | 0.000704020 | 215.054 | 09060047 | 0.00104355 | 0.477629 | 216.240 |
| 3 | 09060049 | 0.478155 | 0.000518024 | 214.856 | 09060051 | 0.00441893 | 0.474254 | 215.506 |