| Red | Green | Blue | |
| z | 17.64 | ||
| znorm | Inf | ||
| sky | -Inf | -Inf | -Inf |
| S/N | 26.8 | 45.8 | 49.4 |
| S/N(c) | 0.0 | 0.0 | 0.0 |
| SN(E/C) |
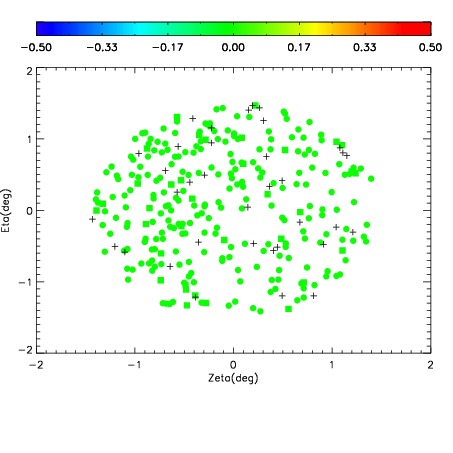

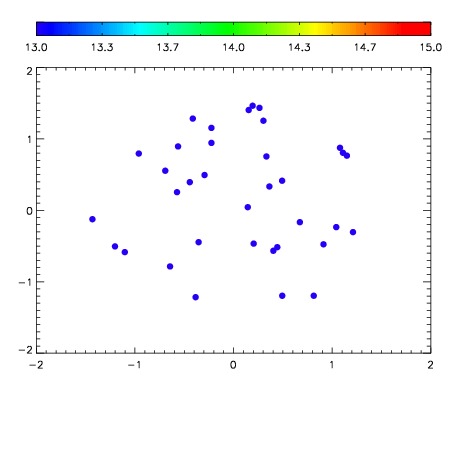

| Frame | Nreads | Zeropoints | Mag plots | Spatial mag deviation | Spatial sky 16325A emission deviations (filled: sky, open: star) | Spatial sky continuum emission | Spatial sky telluric CO2 absorption deviations (filled: H < 10) | |||||||||||||||||||||||
| 0 | 0 |
|
|
|
|
|
|
| IPAIR | NAME | SHIFT | NEWSHIFT | S/N | NAME | SHIFT | NEWSHIFT | S/N |
| 0 | 10020013 | 0.462519 | 0.00000 | 234.894 | 10020014 | 0.00210806 | 0.460411 | 232.643 |
| 1 | 10020016 | 0.461664 | 0.000854999 | 230.651 | 10020018 | 0.00329242 | 0.459227 | 230.737 |
| 2 | 10020017 | 0.462338 | 0.000180990 | 230.425 | 10020015 | 0.00173794 | 0.460781 | 222.345 |
| 3 | 10020012 | 0.461792 | 0.000726998 | 227.717 | 10020011 | 0.00000 | 0.462519 | 219.549 |