| Red | Green | Blue | |
| z | 17.64 | ||
| znorm | Inf | ||
| sky | -Inf | -Inf | -Inf |
| S/N | 28.7 | 48.5 | 52.5 |
| S/N(c) | 0.0 | 0.0 | 0.0 |
| SN(E/C) |

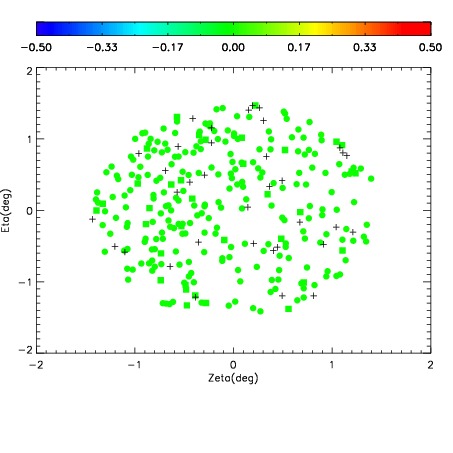
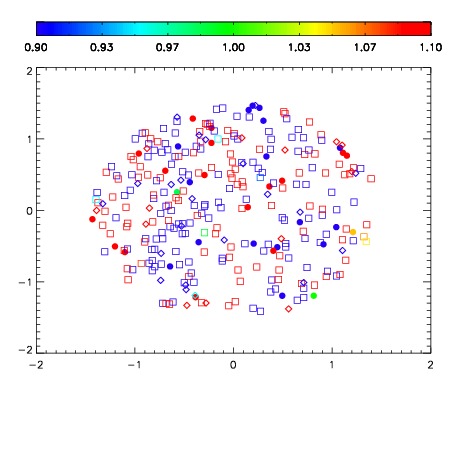
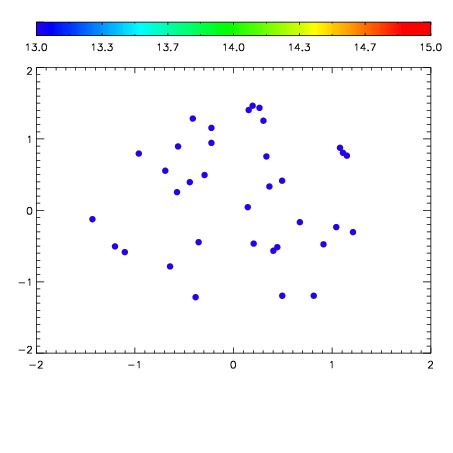

| Frame | Nreads | Zeropoints | Mag plots | Spatial mag deviation | Spatial sky 16325A emission deviations (filled: sky, open: star) | Spatial sky continuum emission | Spatial sky telluric CO2 absorption deviations (filled: H < 10) | |||||||||||||||||||||||
| 0 | 0 |
|
|
|
|
|
|
| IPAIR | NAME | SHIFT | NEWSHIFT | S/N | NAME | SHIFT | NEWSHIFT | S/N |
| 0 | 10060016 | 0.478631 | 0.00000 | 224.747 | 10060013 | 0.00139265 | 0.477238 | 221.188 |
| 1 | 10060015 | 0.477813 | 0.000817984 | 225.786 | 10060014 | 0.00117364 | 0.477457 | 222.632 |
| 2 | 10060011 | 0.475663 | 0.00296798 | 218.309 | 10060017 | 0.00218127 | 0.476450 | 220.062 |
| 3 | 10060012 | 0.476583 | 0.00204799 | 217.731 | 10060010 | 0.00000 | 0.478631 | 215.292 |