| Red | Green | Blue | |
| z | 17.64 | ||
| znorm | Inf | ||
| sky | -Inf | -Inf | -Inf |
| S/N | 26.1 | 44.7 | 49.1 |
| S/N(c) | 0.0 | 0.0 | 0.0 |
| SN(E/C) |
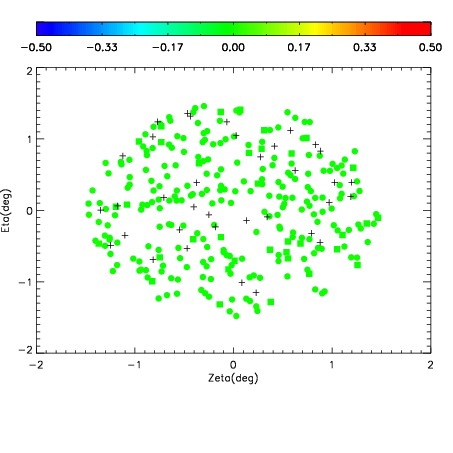
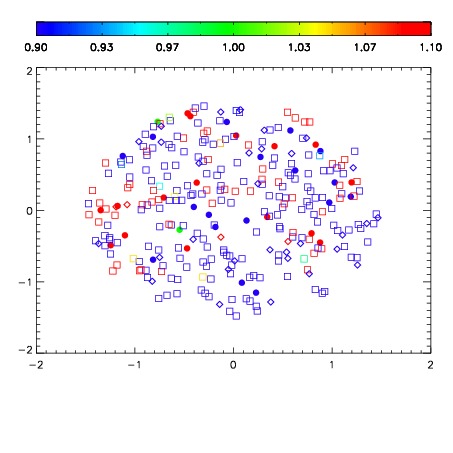
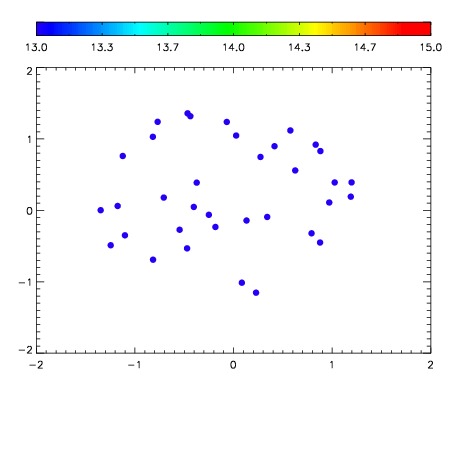

| Frame | Nreads | Zeropoints | Mag plots | Spatial mag deviation | Spatial sky 16325A emission deviations (filled: sky, open: star) | Spatial sky continuum emission | Spatial sky telluric CO2 absorption deviations (filled: H < 10) | |||||||||||||||||||||||
| 0 | 0 |
|
|
|
|
|
|
| IPAIR | NAME | SHIFT | NEWSHIFT | S/N | NAME | SHIFT | NEWSHIFT | S/N |
| 0 | 10070015 | 0.466437 | 0.00000 | 246.821 | 10070013 | 0.00000 | 0.466437 | 248.514 |
| 1 | 10070019 | 0.466342 | 9.50098e-05 | 252.939 | 10070020 | 0.00102896 | 0.465408 | 252.070 |
| 2 | 10070018 | 0.466154 | 0.000283003 | 246.579 | 10070016 | 0.00182763 | 0.464609 | 246.771 |
| 3 | 10070014 | 0.465854 | 0.000583023 | 244.118 | 10070017 | 0.00167957 | 0.464757 | 236.213 |