| Red | Green | Blue | |
| z | 17.64 | ||
| znorm | Inf | ||
| sky | -Inf | -NaN | -Inf |
| S/N | 26.8 | 45.7 | 50.2 |
| S/N(c) | 0.0 | 0.0 | 0.0 |
| SN(E/C) |
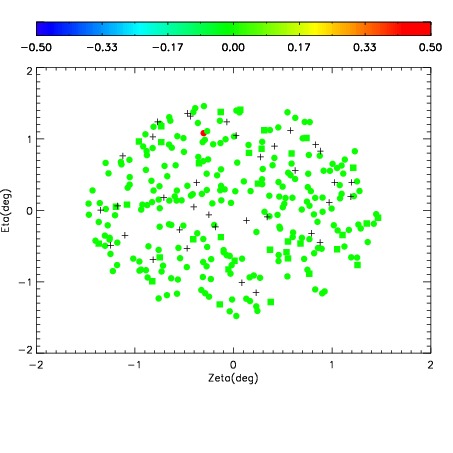
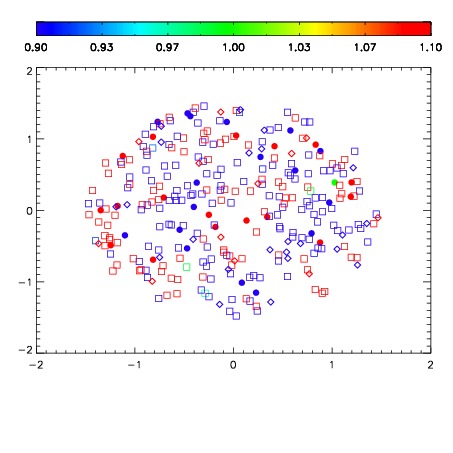
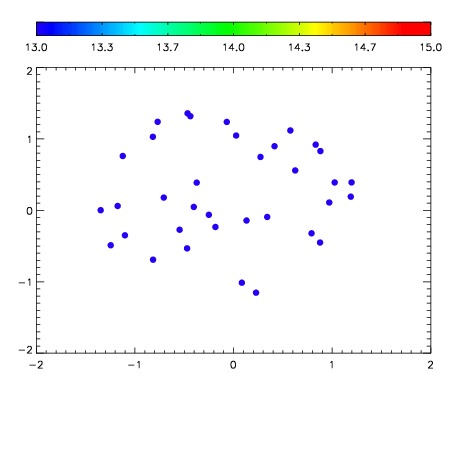

| Frame | Nreads | Zeropoints | Mag plots | Spatial mag deviation | Spatial sky 16325A emission deviations (filled: sky, open: star) | Spatial sky continuum emission | Spatial sky telluric CO2 absorption deviations (filled: H < 10) | |||||||||||||||||||||||
| 0 | 0 |
|
|
|
|
|
|
| IPAIR | NAME | SHIFT | NEWSHIFT | S/N | NAME | SHIFT | NEWSHIFT | S/N |
| 0 | 10110017 | 0.510891 | 0.00000 | 203.064 | 10110011 | 0.00000 | 0.510891 | 207.597 |
| 1 | 10110012 | 0.506336 | 0.00455505 | 213.832 | 10110014 | 0.00308014 | 0.507811 | 209.241 |
| 2 | 10110013 | 0.506852 | 0.00403905 | 212.905 | 10110015 | 0.00330540 | 0.507586 | 209.179 |
| 3 | 10110016 | 0.510284 | 0.000607014 | 205.798 | 10110018 | 0.00351611 | 0.507375 | 208.727 |