| Red | Green | Blue | |
| z | 17.65 | ||
| znorm | Inf | ||
| sky | -NaN | -Inf | -Inf |
| S/N | 11.0 | 19.5 | 19.1 |
| S/N(c) | 0.0 | 0.0 | 0.0 |
| SN(E/C) |
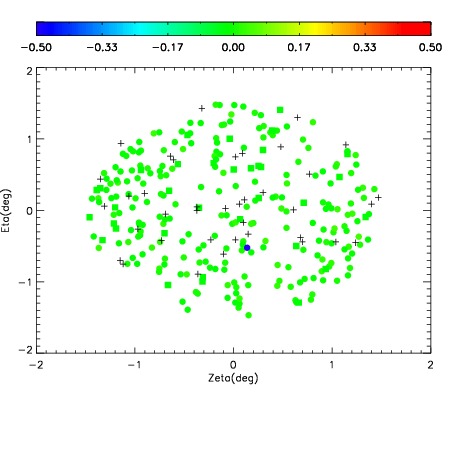

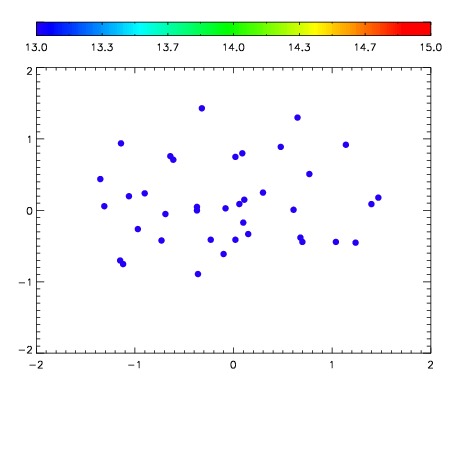

| Frame | Nreads | Zeropoints | Mag plots | Spatial mag deviation | Spatial sky 16325A emission deviations (filled: sky, open: star) | Spatial sky continuum emission | Spatial sky telluric CO2 absorption deviations (filled: H < 10) | |||||||||||||||||||||||
| 0 | 0 |
|
|
|
|
|
|
| IPAIR | NAME | SHIFT | NEWSHIFT | S/N | NAME | SHIFT | NEWSHIFT | S/N |
| 0 | 12120012 | 0.495053 | 0.00000 | 46.8037 | 12120011 | 0.00000 | 0.495053 | 91.8943 |
| 1 | 12120017 | 0.493062 | 0.00199100 | 126.738 | 12120018 | -0.00250578 | 0.497559 | 137.953 |
| 2 | 12120016 | 0.493317 | 0.00173599 | 124.776 | 12120015 | -0.00210579 | 0.497159 | 110.192 |
| 3 | 12120013 | 0.494805 | 0.000247985 | 67.7374 | 12120014 | -0.00216111 | 0.497214 | 97.4022 |