| Red | Green | Blue | |
| z | 17.64 | ||
| znorm | Inf | ||
| sky | -Inf | -Inf | -Inf |
| S/N | 28.1 | 46.0 | 45.1 |
| S/N(c) | 0.0 | 0.0 | 0.0 |
| SN(E/C) |
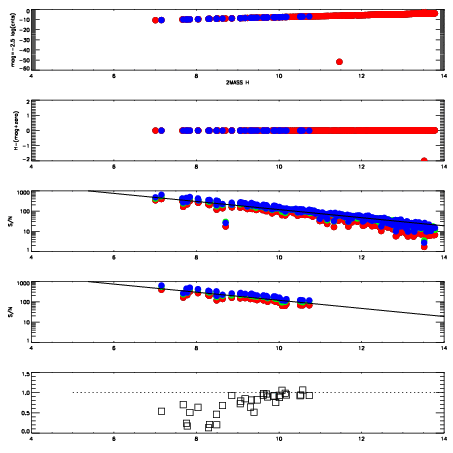


| Frame | Nreads | Zeropoints | Mag plots | Spatial mag deviation | Spatial sky 16325A emission deviations (filled: sky, open: star) | Spatial sky continuum emission | Spatial sky telluric CO2 absorption deviations (filled: H < 10) | |||||||||||||||||||||||
| 0 | 0 |
|
|
|
|
|
|
| IPAIR | NAME | SHIFT | NEWSHIFT | S/N | NAME | SHIFT | NEWSHIFT | S/N |
| 0 | 12180023 | 0.491293 | 0.00000 | 198.893 | 12180029 | -0.00690006 | 0.498193 | 203.894 |
| 1 | 12180027 | 0.489786 | 0.00150701 | 207.643 | 12180025 | -0.00472715 | 0.496020 | 206.668 |
| 2 | 12180028 | 0.490434 | 0.000859022 | 204.046 | 12180026 | -0.00512165 | 0.496415 | 205.103 |
| 3 | 12180024 | 0.491197 | 9.60231e-05 | 195.653 | 12180022 | 0.00000 | 0.491293 | 191.240 |