| Red | Green | Blue | |
| z | 17.64 | ||
| znorm | Inf | ||
| sky | -Inf | -Inf | -Inf |
| S/N | 10.4 | 18.2 | 18.4 |
| S/N(c) | 0.0 | 0.0 | 0.0 |
| SN(E/C) |

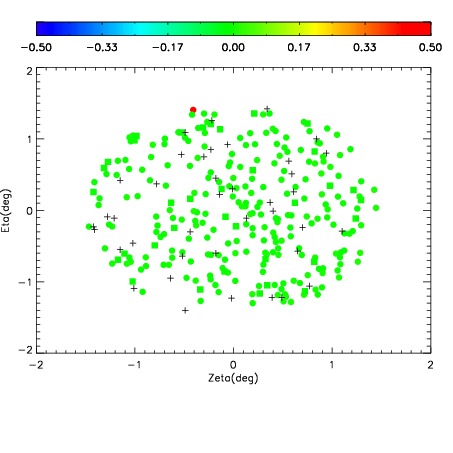
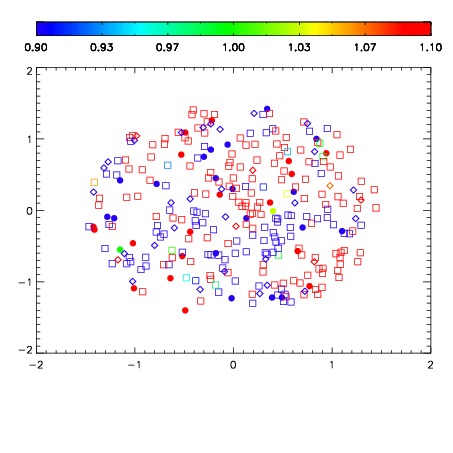


| Frame | Nreads | Zeropoints | Mag plots | Spatial mag deviation | Spatial sky 16325A emission deviations (filled: sky, open: star) | Spatial sky continuum emission | Spatial sky telluric CO2 absorption deviations (filled: H < 10) | |||||||||||||||||||||||
| 0 | 0 |
|
|
|
|
|
|
| IPAIR | NAME | SHIFT | NEWSHIFT | S/N | NAME | SHIFT | NEWSHIFT | S/N |
| 0 | 12590019 | 0.484743 | 0.00000 | 119.355 | 12590017 | -0.00395374 | 0.488697 | 109.895 |
| 1 | 12590018 | 0.484678 | 6.49989e-05 | 126.001 | 12590020 | -0.00153694 | 0.486280 | 123.337 |
| 2 | 12590014 | 0.481297 | 0.00344601 | 93.6072 | 12590016 | -0.00340999 | 0.488153 | 105.573 |
| 3 | 12590015 | 0.482927 | 0.00181600 | 91.8936 | 12590013 | 0.00000 | 0.484743 | 95.1621 |