| Frame | Nreads | Zeropoints | Mag plots
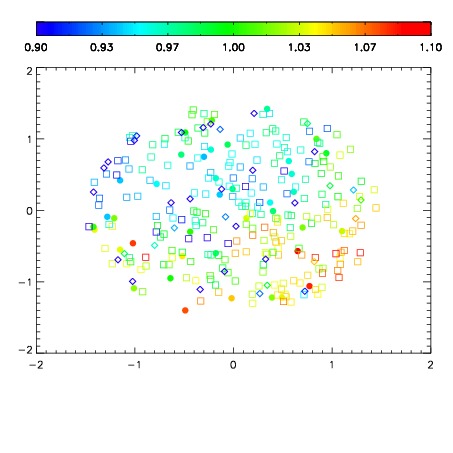
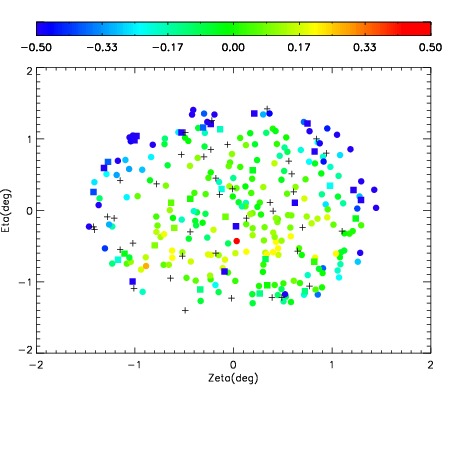
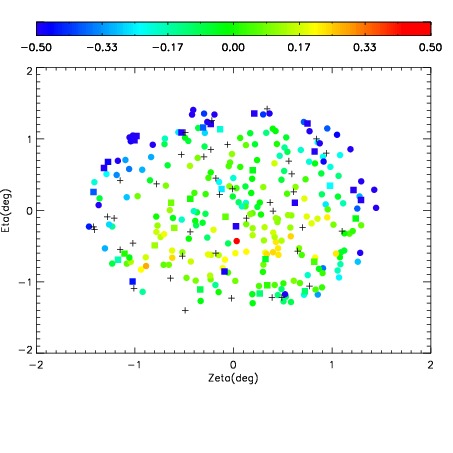
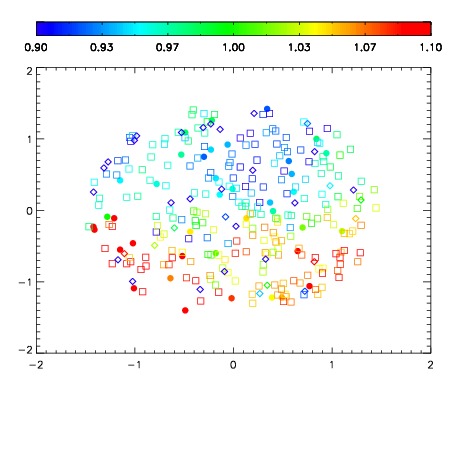
| Spatial mag deviation
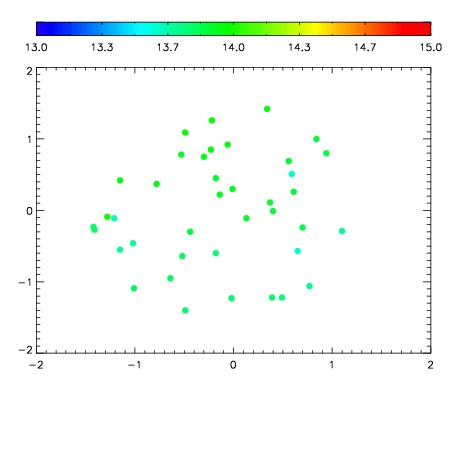
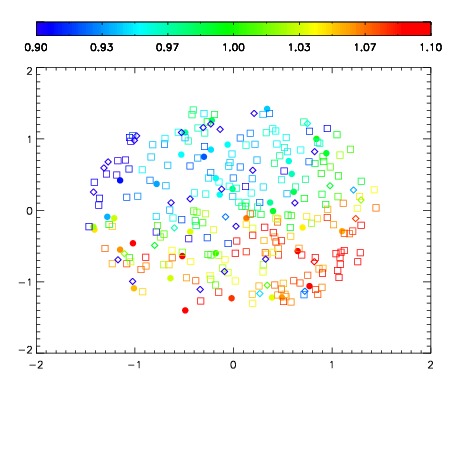
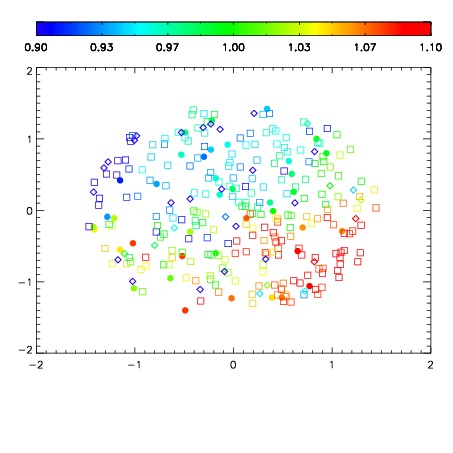
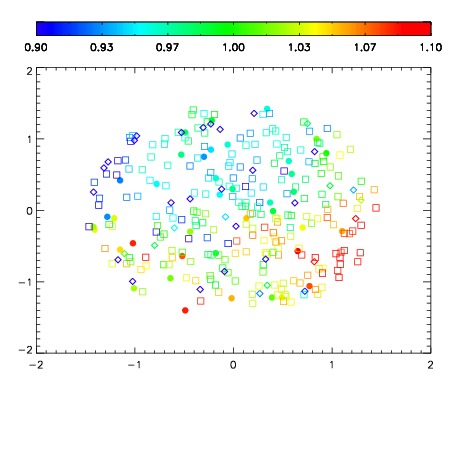
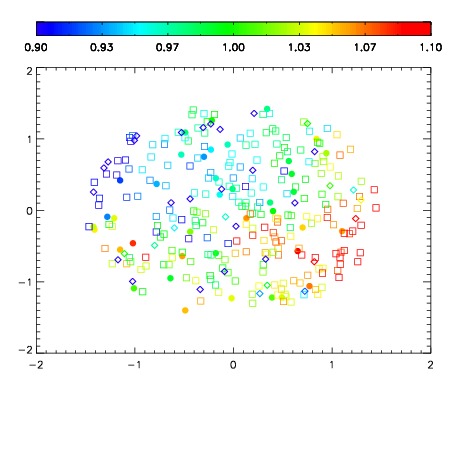
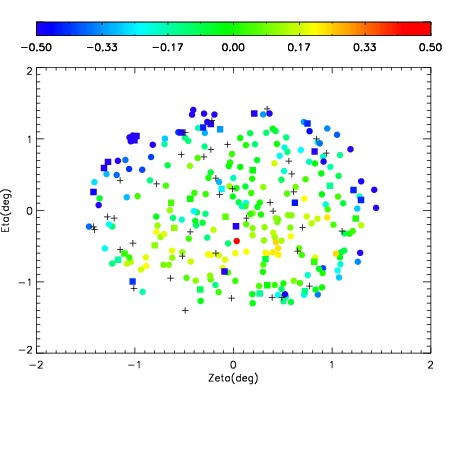
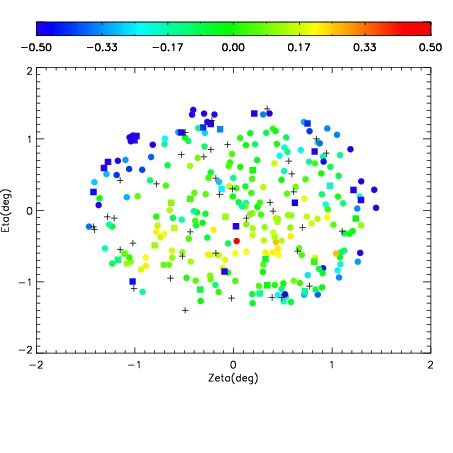
| Spatial sky 16325A emission deviations (filled: sky, open: star)
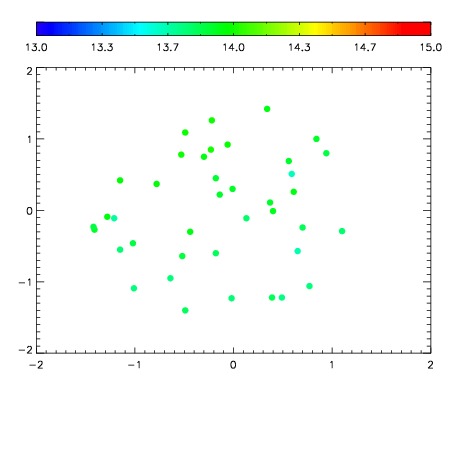
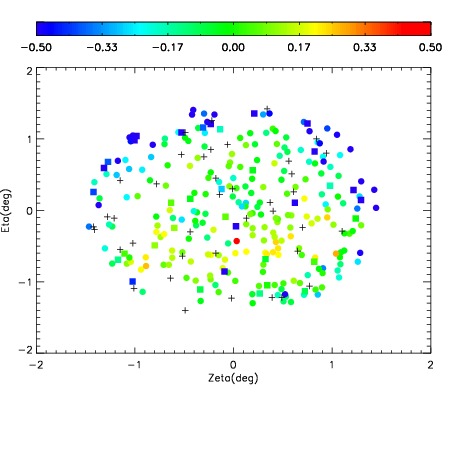
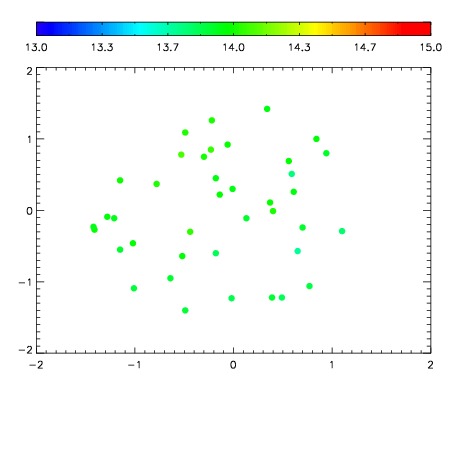
| Spatial sky continuum emission
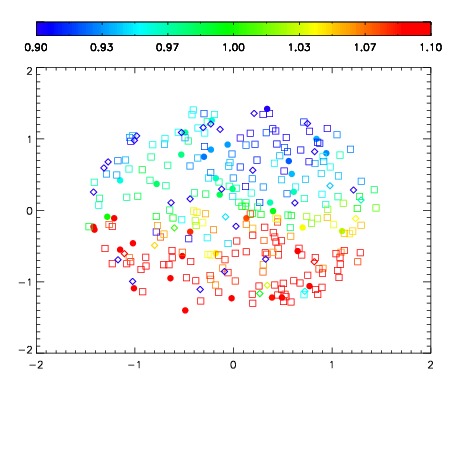
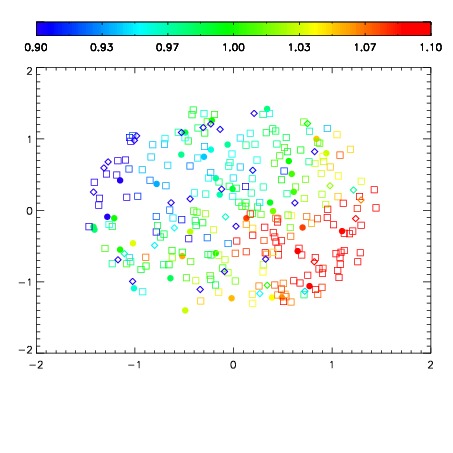
| Spatial sky telluric CO2 absorption deviations (filled: H < 10)
|
| 12610038
| 47
| | Red | Green | Blue
| | z | | 18.73
| | znorm | | 14.55
| | sky | 14.1 | 13.9 | 13.9
| | S/N | 12.6 | 19.0 | 19.2
| | S/N(c) | 10.9 | 16.9 | 18.0
| | SN(E/C) 0.77
|
| 
| 
| 
| 
| 
|
| 12610039
| 47
| | Red | Green | Blue
| | z | | 18.80
| | znorm | | 14.62
| | sky | 14.1 | 13.9 | 13.9
| | S/N | 13.0 | 19.4 | 19.9
| | S/N(c) | 11.3 | 17.8 | 18.7
| | SN(E/C) 0.69
|
| 
| 
| 
| 
| 
|
| 12610040
| 47
| | Red | Green | Blue
| | z | | 18.79
| | znorm | | 14.61
| | sky | 13.9 | 13.8 | 13.9
| | S/N | 12.9 | 19.4 | 20.1
| | S/N(c) | 11.4 | 17.7 | 18.7
| | SN(E/C) 0.67
|
| 
| 
| 
| 
| 
|
| 12610041
| 47
| | Red | Green | Blue
| | z | | 18.78
| | znorm | | 14.60
| | sky | 13.9 | 13.8 | 13.9
| | S/N | 13.1 | 19.4 | 19.8
| | S/N(c) | 11.3 | 17.6 | 18.6
| | SN(E/C) 0.75
|
| 
| 
| 
| 
| 
|
| 12610042
| 47
| | Red | Green | Blue
| | z | | 18.77
| | znorm | | 14.59
| | sky | 14.0 | 13.8 | 13.9
| | S/N | 13.1 | 19.2 | 19.6
| | S/N(c) | 11.4 | 17.4 | 18.2
| | SN(E/C) 0.69
|
| 
| 
| 
| 
| 
|
| 12610043
| 47
| | Red | Green | Blue
| | z | | 18.85
| | znorm | | 14.67
| | sky | 14.0 | 14.0 | 14.0
| | S/N | 13.5 | 20.4 | 20.9
| | S/N(c) | 11.8 | 18.5 | 19.2
| | SN(E/C) 0.67
|
| 
| 
| 
| 
| 
|
| 12610044
| 47
| | Red | Green | Blue
| | z | | 18.84
| | znorm | | 14.66
| | sky | 14.0 | 13.9 | 14.0
| | S/N | 13.5 | 20.2 | 20.7
| | S/N(c) | 11.7 | 18.3 | 18.9
| | SN(E/C) 0.67
|
| 
| 
| 
| 
| 
|
| 12610045
| 47
| | Red | Green | Blue
| | z | | 18.84
| | znorm | | 14.66
| | sky | 14.0 | 13.9 | 14.0
| | S/N | 13.7 | 20.1 | 20.6
| | S/N(c) | 11.9 | 18.4 | 19.0
| | SN(E/C) 0.69
|
| 
| 
| 
| 
| 
|