| Red | Green | Blue | |
| z | 17.64 | ||
| znorm | Inf | ||
| sky | -Inf | -Inf | -Inf |
| S/N | 13.1 | 20.8 | 21.4 |
| S/N(c) | 0.0 | 0.0 | 0.0 |
| SN(E/C) |
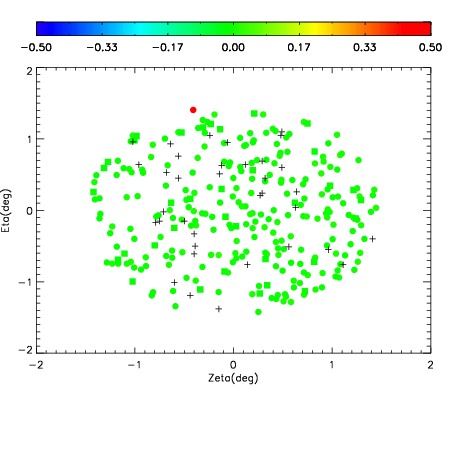
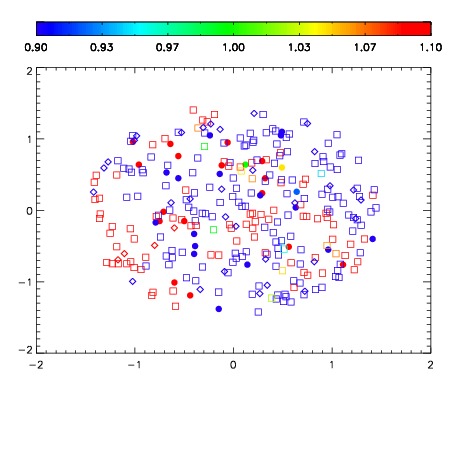
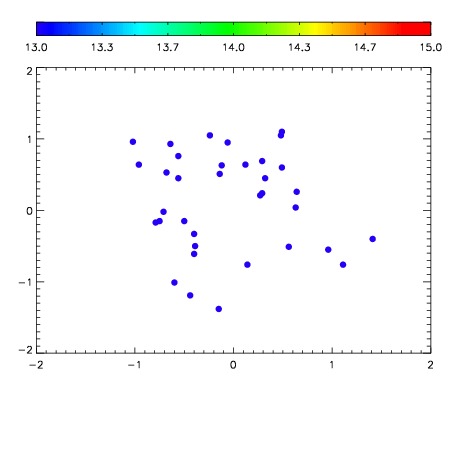

| Frame | Nreads | Zeropoints | Mag plots | Spatial mag deviation | Spatial sky 16325A emission deviations (filled: sky, open: star) | Spatial sky continuum emission | Spatial sky telluric CO2 absorption deviations (filled: H < 10) | |||||||||||||||||||||||
| 0 | 0 |
|
|
|
|
|
|
| IPAIR | NAME | SHIFT | NEWSHIFT | S/N | NAME | SHIFT | NEWSHIFT | S/N |
| 0 | 12320049 | 0.492645 | 0.00000 | 150.777 | 12320051 | 9.27178e-05 | 0.492552 | 153.759 |
| 1 | 12320050 | 0.492086 | 0.000559002 | 140.875 | 12320048 | -0.000982078 | 0.493627 | 148.248 |
| 2 | 12320046 | 0.491110 | 0.00153500 | 64.7406 | 12320047 | -0.00216225 | 0.494807 | 105.081 |
| 3 | 12320045 | 0.491027 | 0.00161800 | 44.2803 | 12320044 | 0.00000 | 0.492645 | 62.1674 |