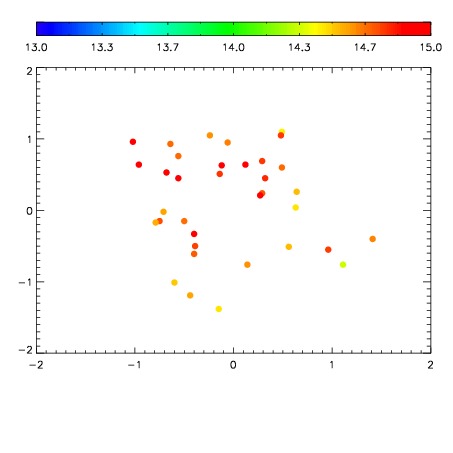
| Frame | Nreads | Zeropoints | Mag plots
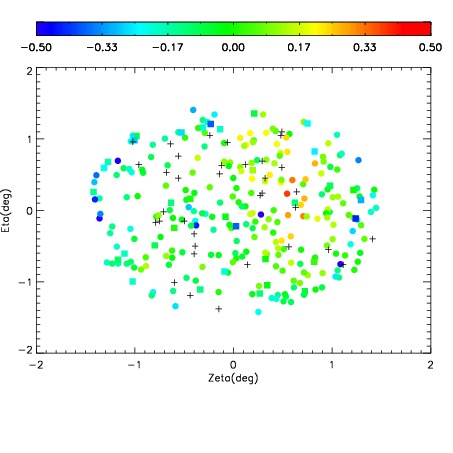
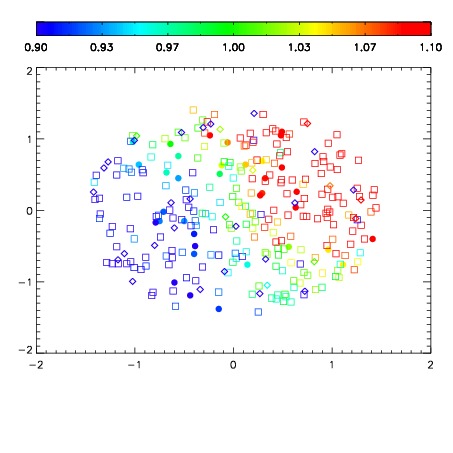
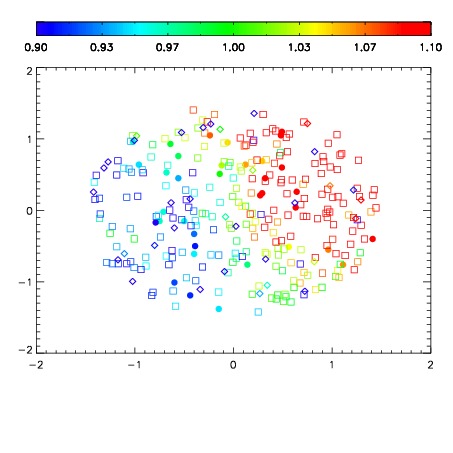
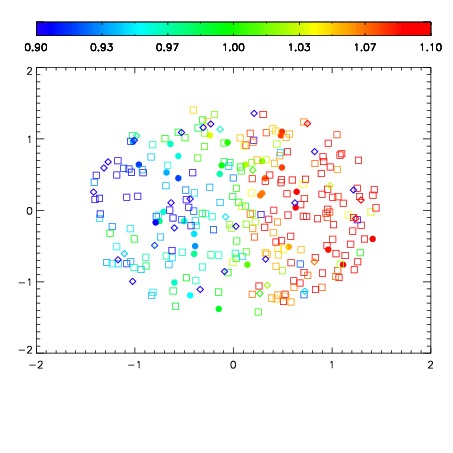
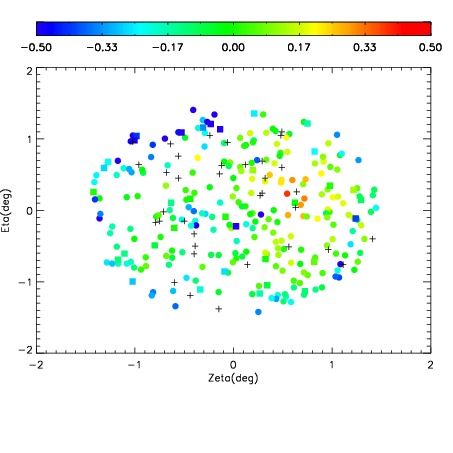
| Spatial mag deviation
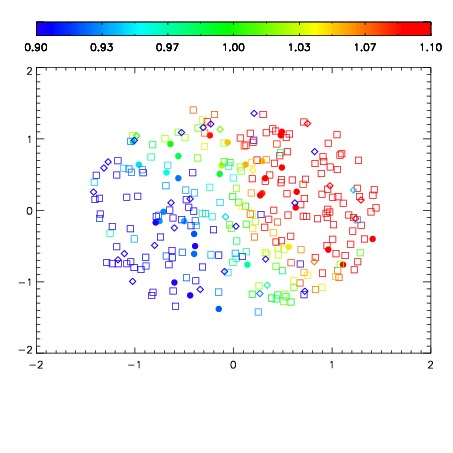
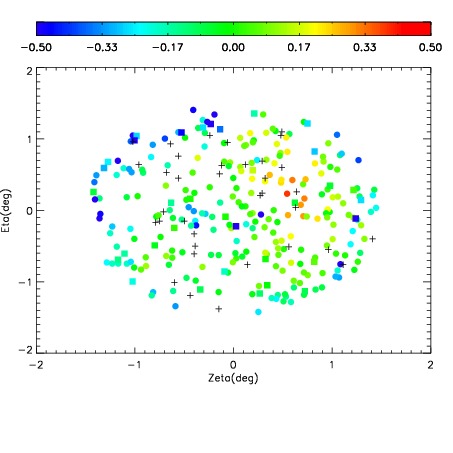
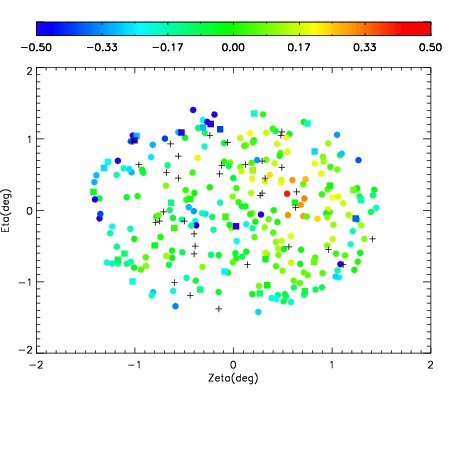
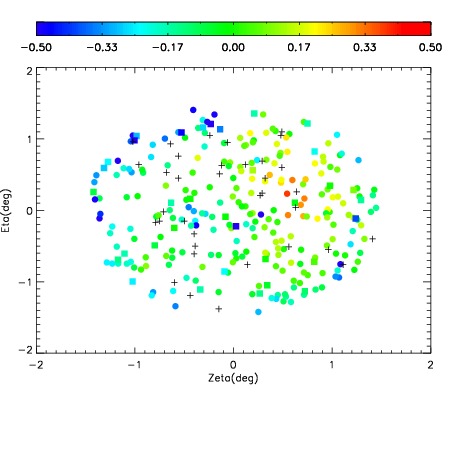
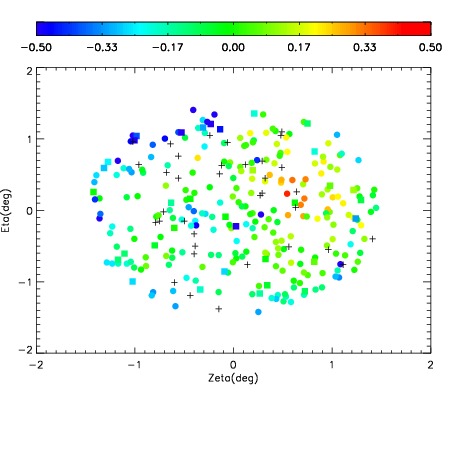
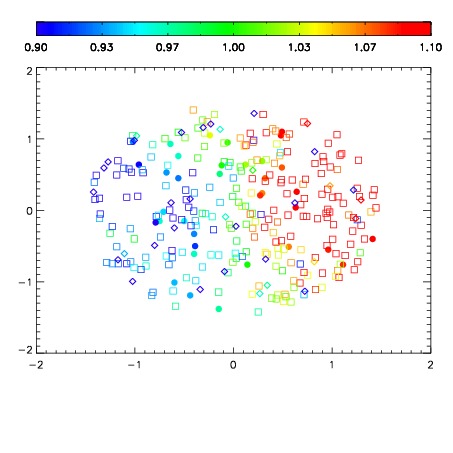
| Spatial sky 16325A emission deviations (filled: sky, open: star)
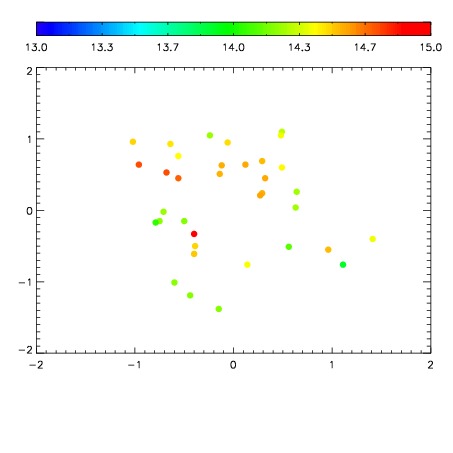
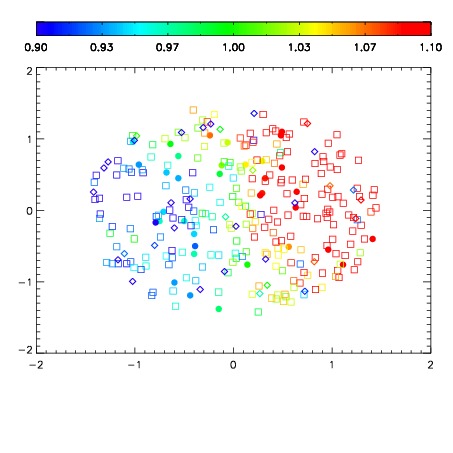
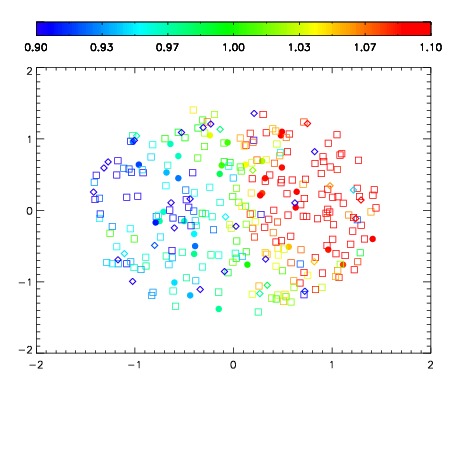
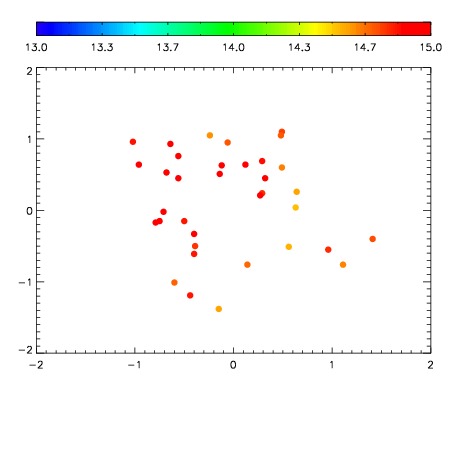
| Spatial sky continuum emission
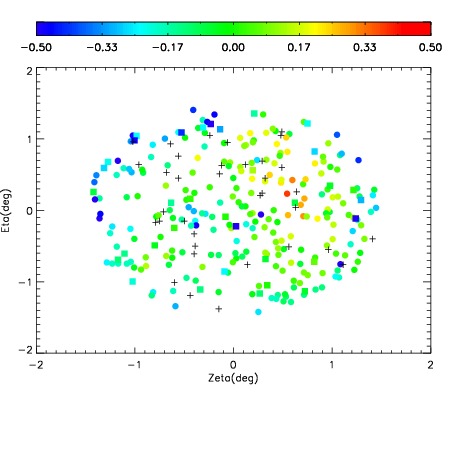
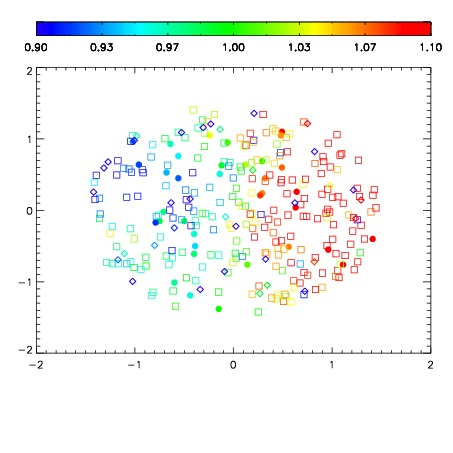
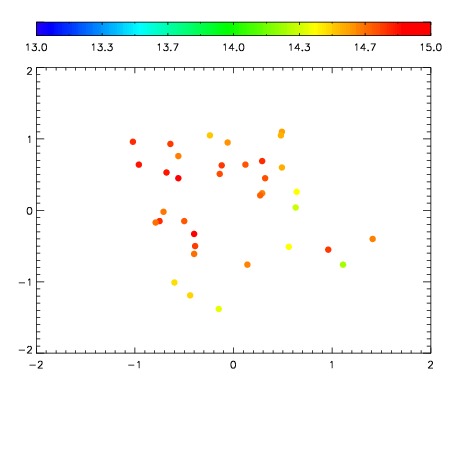
| Spatial sky telluric CO2 absorption deviations (filled: H < 10)
|
| 12500026
| 47
| | Red | Green | Blue
| | z | | 18.52
| | znorm | | 14.34
| | sky | 14.9 | 14.4 | 14.7
| | S/N | 10.3 | 17.6 | 21.1
| | S/N(c) | 8.8 | 16.4 | 18.9
| | SN(E/C) 0.66
|
| 
| 
| 
| 
| 
|
| 12500027
| 47
| | Red | Green | Blue
| | z | | 18.76
| | znorm | | 14.58
| | sky | 14.9 | 14.7 | 15.2
| | S/N | 11.6 | 19.8 | 24.0
| | S/N(c) | 10.4 | 18.6 | 21.7
| | SN(E/C) 0.68
|
| 
| 
| 
| 
| 
|
| 12500028
| 47
| | Red | Green | Blue
| | z | | 18.81
| | znorm | | 14.63
| | sky | 14.6 | 14.6 | 15.0
| | S/N | 12.1 | 20.7 | 24.8
| | S/N(c) | 10.5 | 19.4 | 22.4
| | SN(E/C) 0.64
|
| 
| 
| 
| 
| 
|
| 12500029
| 47
| | Red | Green | Blue
| | z | | 18.77
| | znorm | | 14.59
| | sky | 14.7 | 14.7 | 15.0
| | S/N | 12.6 | 21.0 | 23.9
| | S/N(c) | 10.8 | 19.6 | 21.7
| | SN(E/C) 0.60
|
| 
| 
| 
| 
| 
|
| 12500030
| 47
| | Red | Green | Blue
| | z | | 18.76
| | znorm | | 14.58
| | sky | 14.8 | 14.7 | 15.0
| | S/N | 12.1 | 20.9 | 23.7
| | S/N(c) | 10.9 | 19.3 | 21.2
| | SN(E/C) 0.67
|
| 
| 
| 
| 
| 
|
| 12500031
| 47
| | Red | Green | Blue
| | z | | 18.76
| | znorm | | 14.58
| | sky | 14.9 | 14.7 | 15.1
| | S/N | 12.5 | 21.4 | 23.8
| | S/N(c) | 11.1 | 19.7 | 21.3
| | SN(E/C) 0.63
|
| 
| 
| 
| 
| 
|
| 12500032
| 47
| | Red | Green | Blue
| | z | | 18.74
| | znorm | | 14.56
| | sky | 14.8 | 14.7 | 15.1
| | S/N | 12.5 | 21.3 | 23.1
| | S/N(c) | 11.0 | 19.7 | 20.6
| | SN(E/C) 0.62
|
| 
| 
| 
| 
| 
|
| 12500033
| 47
| | Red | Green | Blue
| | z | | 18.86
| | znorm | | 14.68
| | sky | 14.6 | 14.8 | 15.2
| | S/N | 13.5 | 22.3 | 24.5
| | S/N(c) | 12.1 | 20.7 | 22.1
| | SN(E/C) 0.66
|
| 
| 
| 
| 
| 
|