| Red | Green | Blue | |
| z | 17.65 | ||
| znorm | Inf | ||
| sky | -Inf | -Inf | -Inf |
| S/N | 21.3 | 38.4 | 42.5 |
| S/N(c) | 0.0 | 0.0 | 0.0 |
| SN(E/C) |
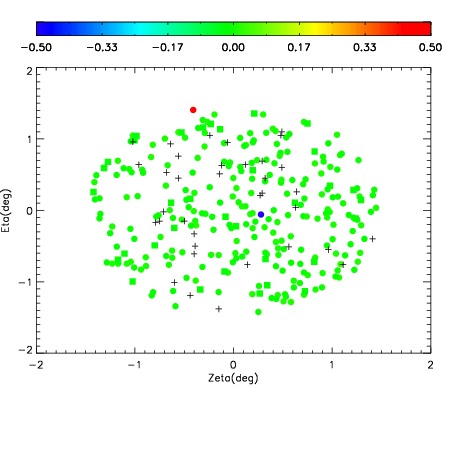
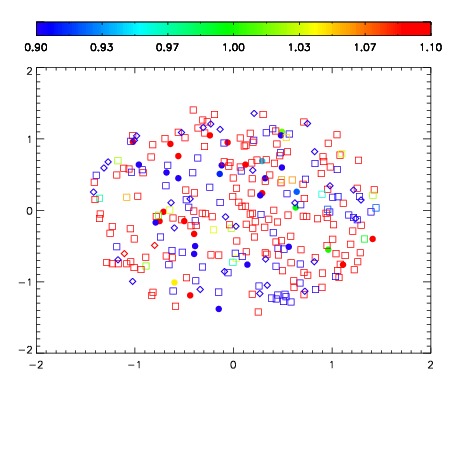
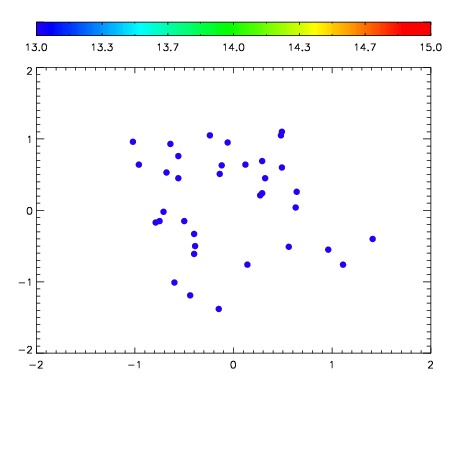

| Frame | Nreads | Zeropoints | Mag plots | Spatial mag deviation | Spatial sky 16325A emission deviations (filled: sky, open: star) | Spatial sky continuum emission | Spatial sky telluric CO2 absorption deviations (filled: H < 10) | |||||||||||||||||||||||
| 0 | 0 |
|
|
|
|
|
|
| IPAIR | NAME | SHIFT | NEWSHIFT | S/N | NAME | SHIFT | NEWSHIFT | S/N |
| 0 | 12500028 | 0.495460 | 0.00000 | 182.280 | 12500033 | 0.000648112 | 0.494812 | 187.342 |
| 1 | 12500031 | 0.494278 | 0.00118199 | 179.249 | 12500029 | 0.000282181 | 0.495178 | 183.046 |
| 2 | 12500027 | 0.494342 | 0.00111800 | 179.121 | 12500030 | 0.000692343 | 0.494768 | 177.192 |
| 3 | 12500032 | 0.494933 | 0.000526994 | 177.335 | 12500026 | 0.00000 | 0.495460 | 160.960 |