| Red | Green | Blue | |
| z | 17.64 | ||
| znorm | Inf | ||
| sky | -Inf | -Inf | -Inf |
| S/N | 19.8 | 32.0 | 29.4 |
| S/N(c) | 0.0 | 0.0 | 0.0 |
| SN(E/C) |

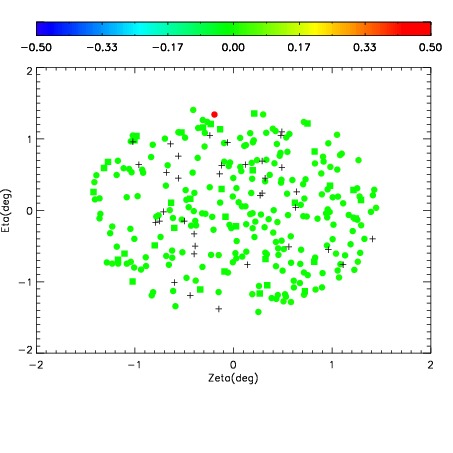
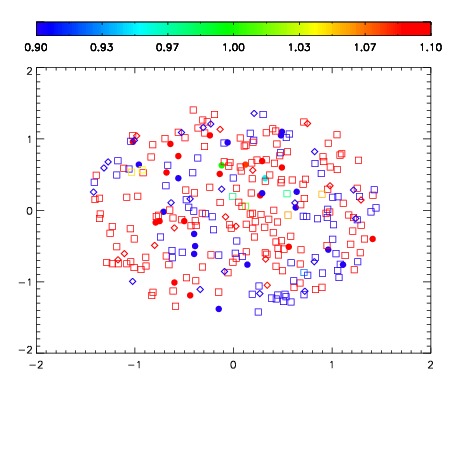


| Frame | Nreads | Zeropoints | Mag plots | Spatial mag deviation | Spatial sky 16325A emission deviations (filled: sky, open: star) | Spatial sky continuum emission | Spatial sky telluric CO2 absorption deviations (filled: H < 10) | |||||||||||||||||||||||
| 0 | 0 |
|
|
|
|
|
|
| IPAIR | NAME | SHIFT | NEWSHIFT | S/N | NAME | SHIFT | NEWSHIFT | S/N |
| 0 | 12660028 | 0.486867 | 0.00000 | 142.857 | 12660029 | 0.000533677 | 0.486333 | 151.987 |
| 1 | 12660027 | 0.485989 | 0.000878006 | 130.388 | 12660026 | -0.000432549 | 0.487300 | 120.843 |
| 2 | 12660024 | 0.485521 | 0.00134602 | 110.639 | 12660025 | -0.00162582 | 0.488493 | 113.547 |
| 3 | 12660023 | 0.484715 | 0.00215200 | 99.2933 | 12660022 | 0.00000 | 0.486867 | 110.936 |