| Red | Green | Blue | |
| z | 17.64 | ||
| znorm | Inf | ||
| sky | -Inf | -Inf | -Inf |
| S/N | 11.9 | 21.0 | 23.8 |
| S/N(c) | 0.0 | 0.0 | 0.0 |
| SN(E/C) |
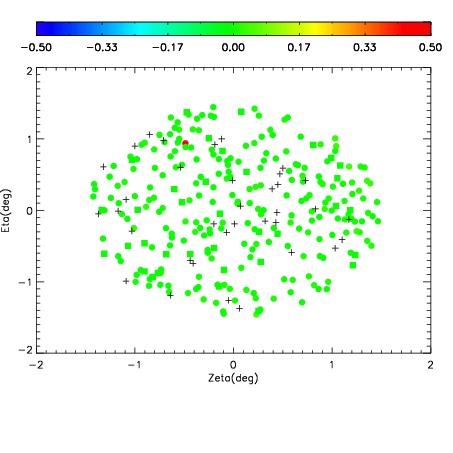
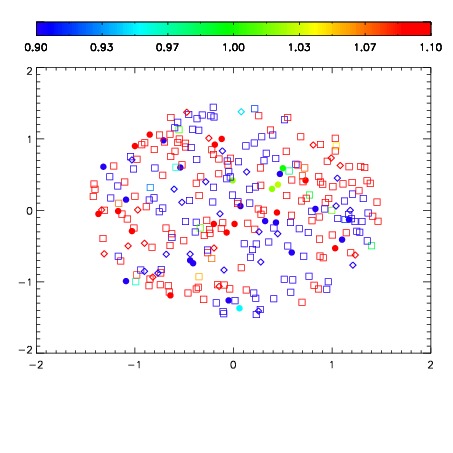
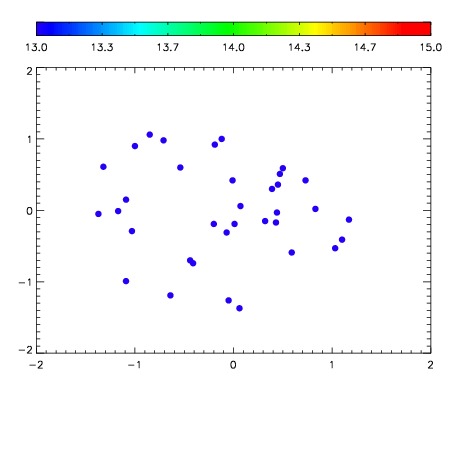

| Frame | Nreads | Zeropoints | Mag plots | Spatial mag deviation | Spatial sky 16325A emission deviations (filled: sky, open: star) | Spatial sky continuum emission | Spatial sky telluric CO2 absorption deviations (filled: H < 10) | |||||||||||||||||||||||
| 0 | 0 |
|
|
|
|
|
|
| IPAIR | NAME | SHIFT | NEWSHIFT | S/N | NAME | SHIFT | NEWSHIFT | S/N |
| 0 | 12620024 | 0.488052 | 0.00000 | 182.070 | 12620022 | 0.00000 | 0.488052 | 155.115 |
| 1 | 12620023 | 0.487034 | 0.00101802 | 162.072 | 12620025 | 0.000629574 | 0.487422 | 152.623 |
| 2 | 12620027 | 0.487036 | 0.00101602 | 100.117 | 12620029 | -0.000219164 | 0.488271 | 105.397 |
| 3 | 12620028 | 0.487944 | 0.000108004 | 55.7175 | 12620026 | 0.00165062 | 0.486401 | 72.7487 |