| Red | Green | Blue | |
| z | 17.64 | ||
| znorm | Inf | ||
| sky | -Inf | -Inf | -Inf |
| S/N | 15.0 | 28.5 | 31.6 |
| S/N(c) | 0.0 | 0.0 | 0.0 |
| SN(E/C) |
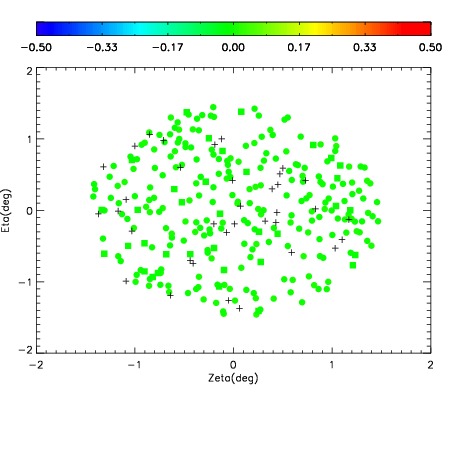
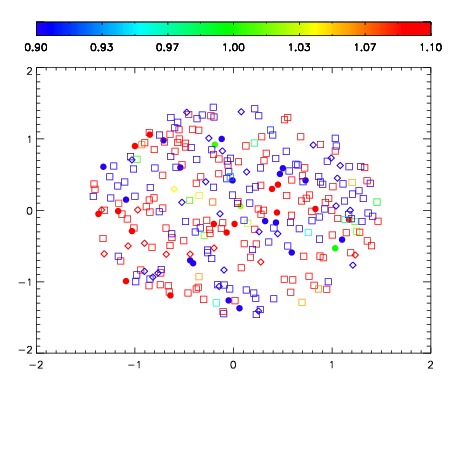
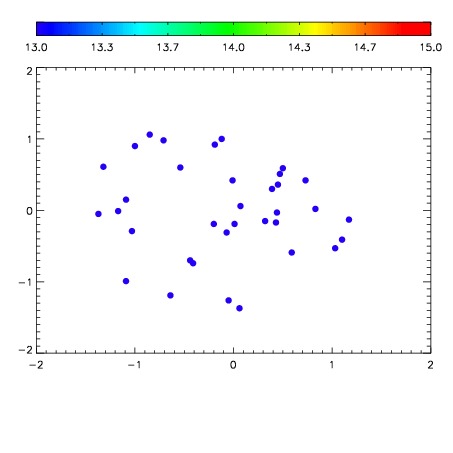

| Frame | Nreads | Zeropoints | Mag plots | Spatial mag deviation | Spatial sky 16325A emission deviations (filled: sky, open: star) | Spatial sky continuum emission | Spatial sky telluric CO2 absorption deviations (filled: H < 10) | |||||||||||||||||||||||
| 0 | 0 |
|
|
|
|
|
|
| IPAIR | NAME | SHIFT | NEWSHIFT | S/N | NAME | SHIFT | NEWSHIFT | S/N |
| 0 | 12720036 | 0.489525 | 0.00000 | 143.036 | 12720034 | 0.00000 | 0.489525 | 136.459 |
| 1 | 12720040 | 0.488693 | 0.000831991 | 153.732 | 12720041 | -0.000608961 | 0.490134 | 160.573 |
| 2 | 12720039 | 0.488371 | 0.00115398 | 151.927 | 12720038 | -0.00188133 | 0.491406 | 143.880 |
| 3 | 12720035 | 0.489019 | 0.000505984 | 140.403 | 12720037 | -0.00187276 | 0.491398 | 134.966 |