| Frame | Nreads | Zeropoints | Mag plots
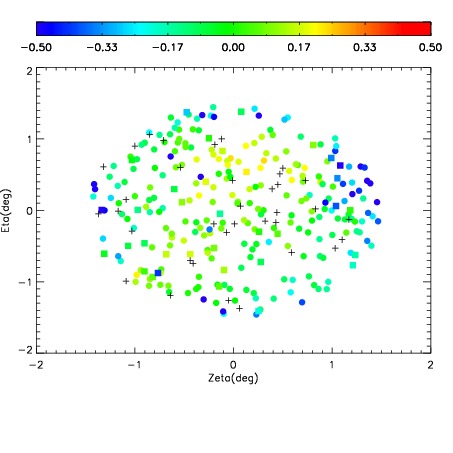
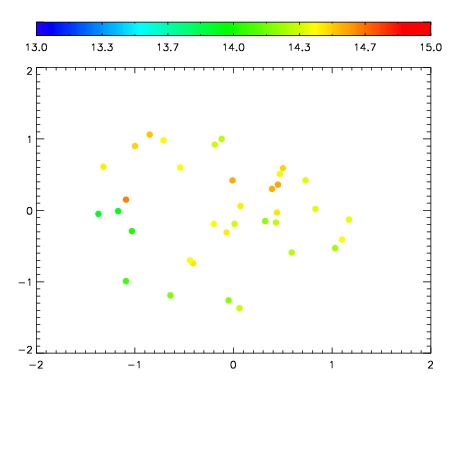
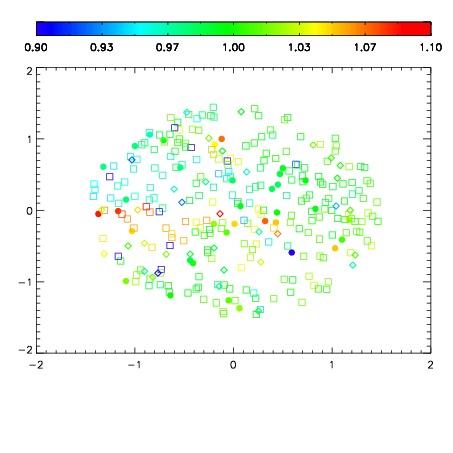
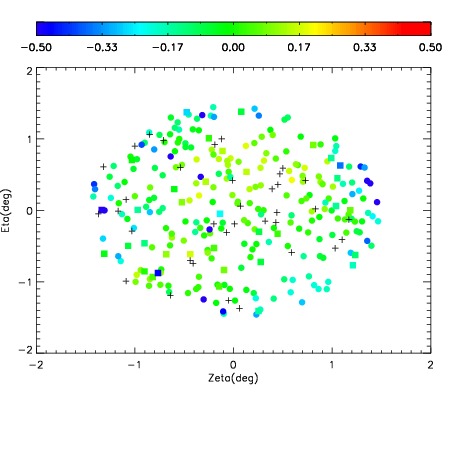
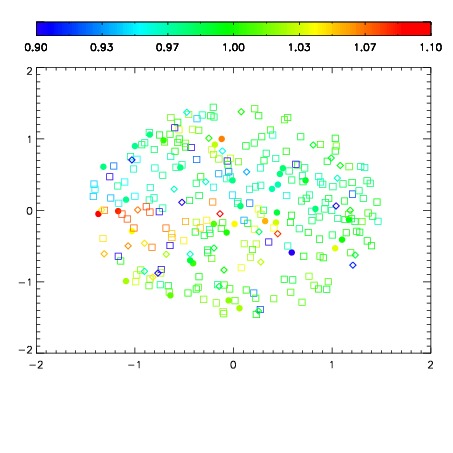
| Spatial mag deviation
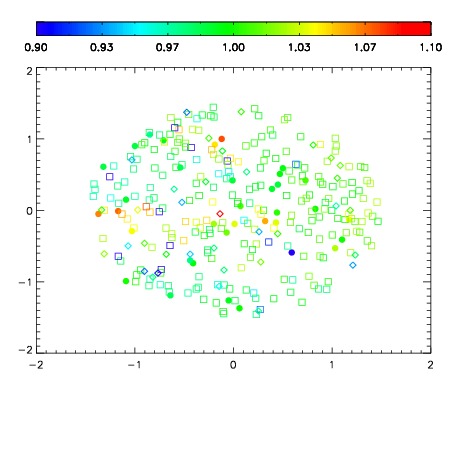
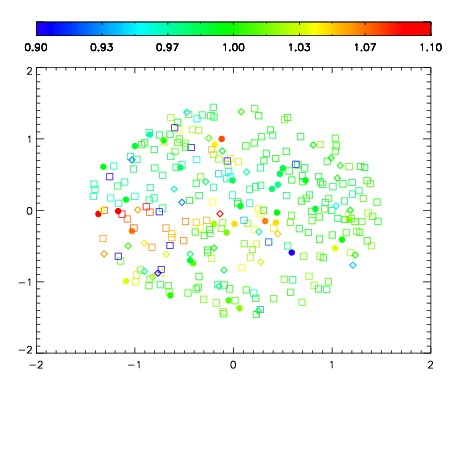
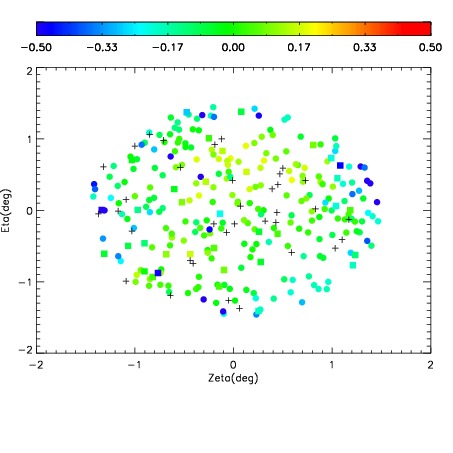
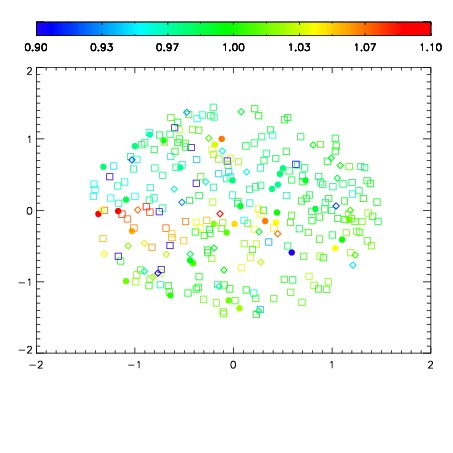
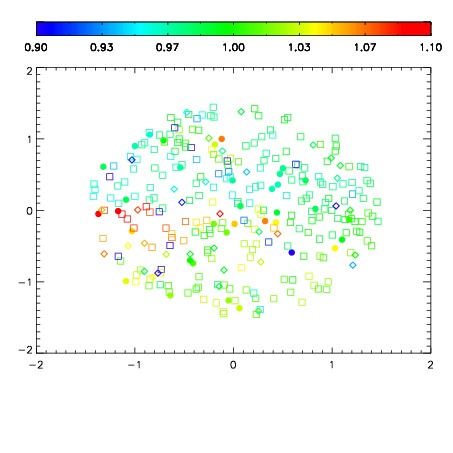
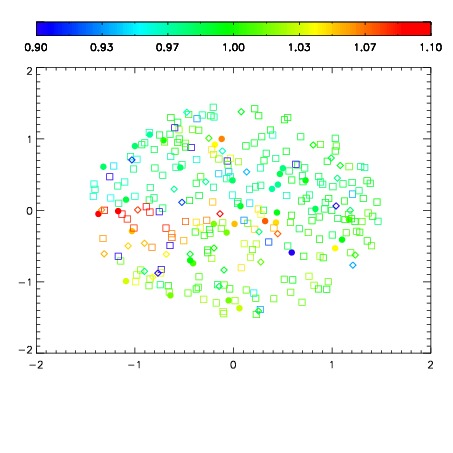
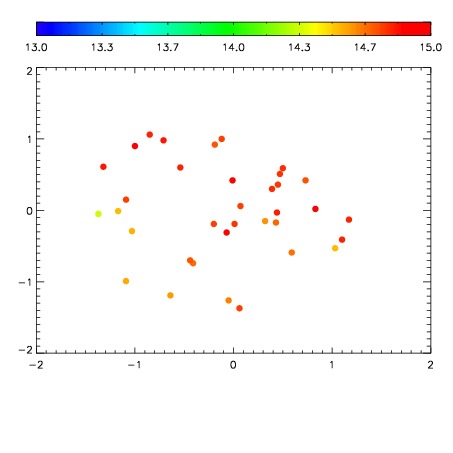
| Spatial sky 16325A emission deviations (filled: sky, open: star)
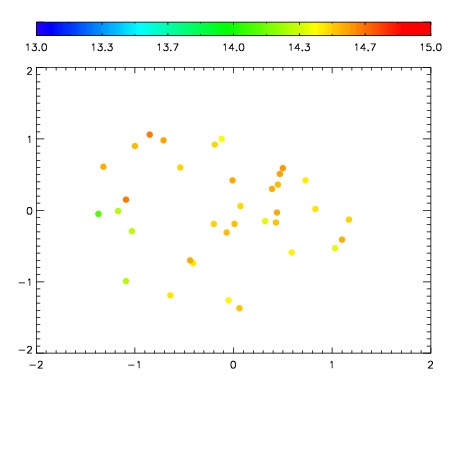
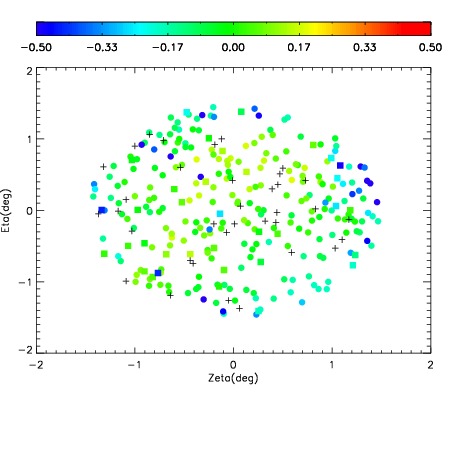
| Spatial sky continuum emission
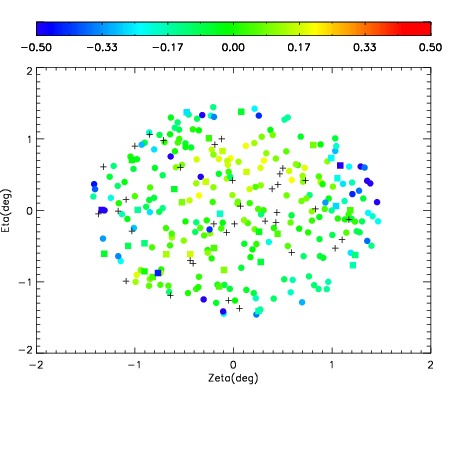
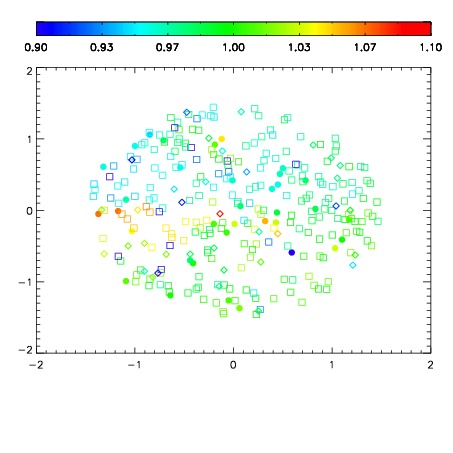
| Spatial sky telluric CO2 absorption deviations (filled: H < 10)
|
| 12740032
| 47
| | Red | Green | Blue
| | z | | 18.79
| | znorm | | 14.61
| | sky | 14.7 | 14.4 | 14.2
| | S/N | 12.6 | 20.7 | 22.6
| | S/N(c) | 10.9 | 18.8 | 21.5
| | SN(E/C) 0.80
|
| 
| 
| 
| 
| 
|
| 12740033
| 47
| | Red | Green | Blue
| | z | | 18.88
| | znorm | | 14.70
| | sky | 14.8 | 14.4 | 14.5
| | S/N | 13.2 | 21.7 | 23.8
| | S/N(c) | 11.7 | 19.9 | 22.7
| | SN(E/C) 0.83
|
| 
| 
| 
| 
| 
|
| 12740034
| 47
| | Red | Green | Blue
| | z | | 18.80
| | znorm | | 14.62
| | sky | 14.6 | 14.5 | 14.6
| | S/N | 12.6 | 20.8 | 22.6
| | S/N(c) | 11.0 | 19.3 | 21.7
| | SN(E/C) 0.81
|
| 
| 
| 
| 
| 
|
| 12740035
| 47
| | Red | Green | Blue
| | z | | 18.91
| | znorm | | 14.73
| | sky | 14.9 | 14.5 | 14.5
| | S/N | 13.4 | 22.4 | 23.6
| | S/N(c) | 12.0 | 20.7 | 22.9
| | SN(E/C) 0.87
|
| 
| 
| 
| 
| 
|
| 12740036
| 47
| | Red | Green | Blue
| | z | | 18.87
| | znorm | | 14.69
| | sky | 14.8 | 14.5 | 14.5
| | S/N | 13.1 | 21.8 | 23.2
| | S/N(c) | 0.0 | 0.0 | 0.0
| | SN(E/C) 0.66
|
| 
| 
| 
| 
| 
|
| 12740037
| 47
| | Red | Green | Blue
| | z | | 18.95
| | znorm | | 14.77
| | sky | 14.7 | 14.6 | 14.7
| | S/N | 13.6 | 22.8 | 24.6
| | S/N(c) | 12.2 | 20.9 | 23.6
| | SN(E/C) 0.77
|
| 
| 
| 
| 
| 
|
| 12740038
| 47
| | Red | Green | Blue
| | z | | 18.98
| | znorm | | 14.79
| | sky | 14.8 | 14.6 | 14.6
| | S/N | 14.1 | 23.1 | 24.3
| | S/N(c) | 12.6 | 21.6 | 23.2
| | SN(E/C) 0.78
|
| 
| 
| 
| 
| 
|
| 12740039
| 47
| | Red | Green | Blue
| | z | | 19.02
| | znorm | | 14.84
| | sky | 15.0 | 14.8 | 14.6
| | S/N | 14.3 | 23.8 | 24.5
| | S/N(c) | 13.0 | 22.2 | 24.0
| | SN(E/C) 0.79
|
| 
| 
| 
| 
| 
|