| Red | Green | Blue | |
| z | 17.64 | ||
| znorm | Inf | ||
| sky | -Inf | -Inf | -Inf |
| S/N | 21.2 | 35.7 | 40.1 |
| S/N(c) | 0.0 | 0.0 | 0.0 |
| SN(E/C) |

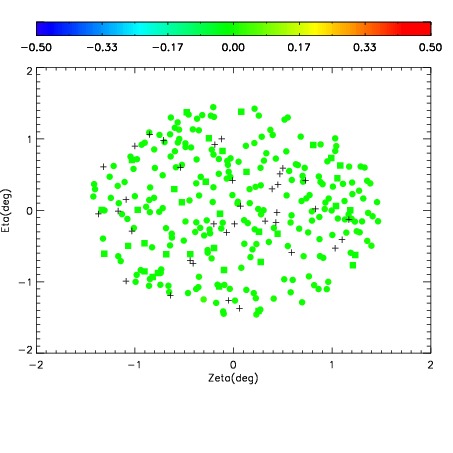
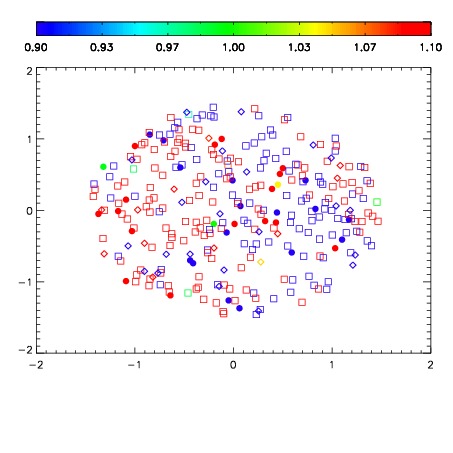
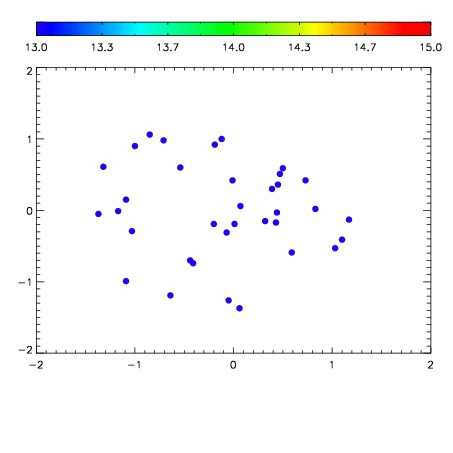

| Frame | Nreads | Zeropoints | Mag plots | Spatial mag deviation | Spatial sky 16325A emission deviations (filled: sky, open: star) | Spatial sky continuum emission | Spatial sky telluric CO2 absorption deviations (filled: H < 10) | |||||||||||||||||||||||
| 0 | 0 |
|
|
|
|
|
|
| IPAIR | NAME | SHIFT | NEWSHIFT | S/N | NAME | SHIFT | NEWSHIFT | S/N |
| 0 | 12740038 | 0.486090 | 0.00000 | 212.616 | 12740035 | -0.000720185 | 0.486810 | 205.703 |
| 1 | 12740037 | 0.485504 | 0.000586003 | 215.218 | 12740039 | 0.00202452 | 0.484065 | 220.560 |
| 2 | 12740033 | 0.483349 | 0.00274101 | 202.786 | 12740032 | 0.00000 | 0.486090 | 199.313 |