| Red | Green | Blue | |
| z | 17.64 | ||
| znorm | Inf | ||
| sky | -Inf | -Inf | -Inf |
| S/N | 10.5 | 21.1 | 22.6 |
| S/N(c) | 0.0 | 0.0 | 0.0 |
| SN(E/C) |

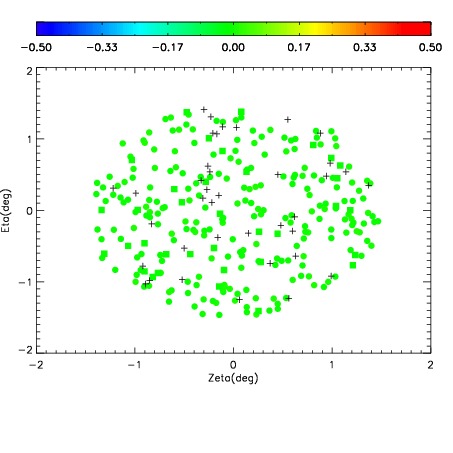
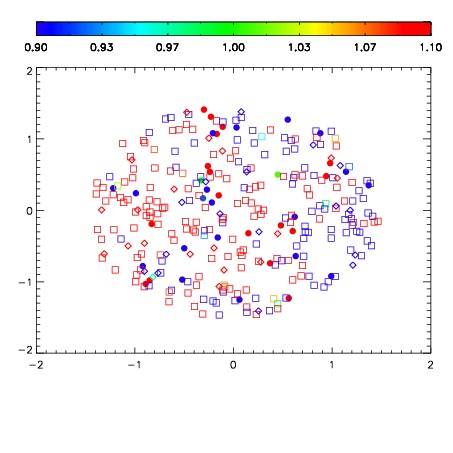
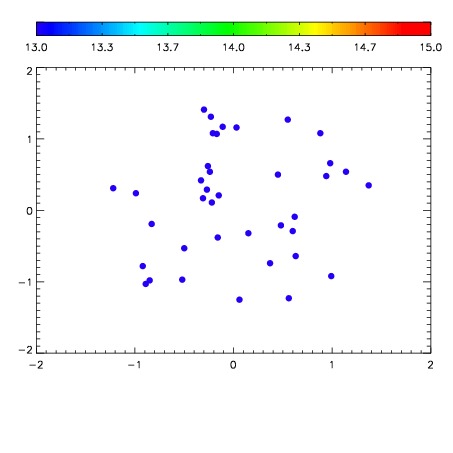

| Frame | Nreads | Zeropoints | Mag plots | Spatial mag deviation | Spatial sky 16325A emission deviations (filled: sky, open: star) | Spatial sky continuum emission | Spatial sky telluric CO2 absorption deviations (filled: H < 10) | |||||||||||||||||||||||
| 0 | 0 |
|
|
|
|
|
|
| IPAIR | NAME | SHIFT | NEWSHIFT | S/N | NAME | SHIFT | NEWSHIFT | S/N |
| 0 | 12290041 | 0.495251 | 0.00000 | 137.462 | 12290039 | -0.00141560 | 0.496667 | 124.724 |
| 1 | 12290037 | 0.494835 | 0.000416011 | 148.246 | 12290042 | -0.000322615 | 0.495574 | 156.918 |
| 2 | 12290036 | 0.494464 | 0.000786990 | 138.798 | 12290035 | 0.00000 | 0.495251 | 126.609 |
| 3 | 12290040 | 0.494945 | 0.000306010 | 136.250 | 12290038 | -0.00172737 | 0.496978 | 119.159 |