| Red | Green | Blue | |
| z | 17.64 | ||
| znorm | Inf | ||
| sky | -Inf | -Inf | -Inf |
| S/N | 25.0 | 39.6 | 39.5 |
| S/N(c) | 0.0 | 0.0 | 0.0 |
| SN(E/C) |
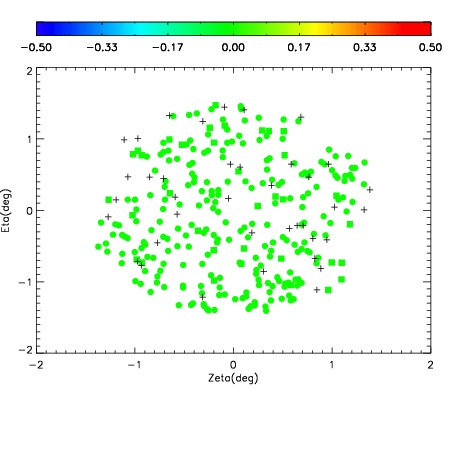
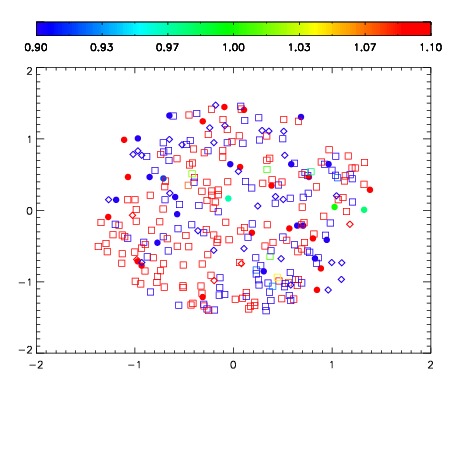
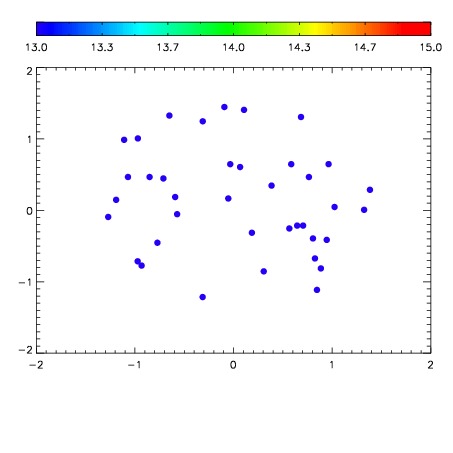

| Frame | Nreads | Zeropoints | Mag plots | Spatial mag deviation | Spatial sky 16325A emission deviations (filled: sky, open: star) | Spatial sky continuum emission | Spatial sky telluric CO2 absorption deviations (filled: H < 10) | |||||||||||||||||||||||
| 0 | 0 |
|
|
|
|
|
|
| IPAIR | NAME | SHIFT | NEWSHIFT | S/N | NAME | SHIFT | NEWSHIFT | S/N |
| 0 | 12060098 | 0.505738 | 0.00000 | 232.644 | 12060099 | -0.00175351 | 0.507492 | 229.255 |
| 1 | 12060097 | 0.505583 | 0.000155032 | 232.369 | 12060096 | -0.00185000 | 0.507588 | 227.488 |
| 2 | 12060093 | 0.503795 | 0.00194299 | 215.854 | 12060095 | -0.00168785 | 0.507426 | 216.125 |
| 3 | 12060094 | 0.504569 | 0.00116903 | 214.069 | 12060092 | 0.00000 | 0.505738 | 215.631 |