| Red | Green | Blue | |
| z | 17.64 | ||
| znorm | Inf | ||
| sky | -Inf | -Inf | -Inf |
| S/N | 24.3 | 37.9 | 38.6 |
| S/N(c) | 0.0 | 0.0 | 0.0 |
| SN(E/C) |
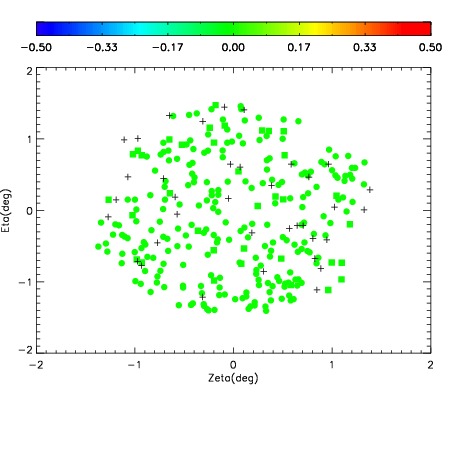
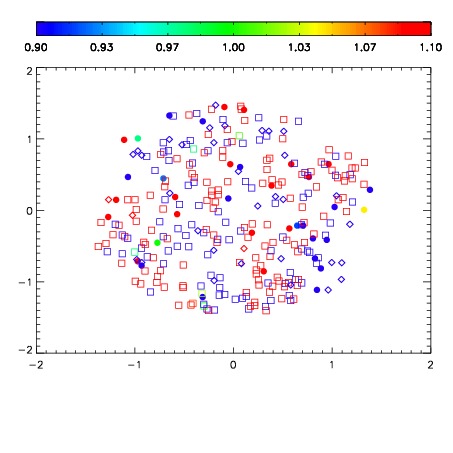
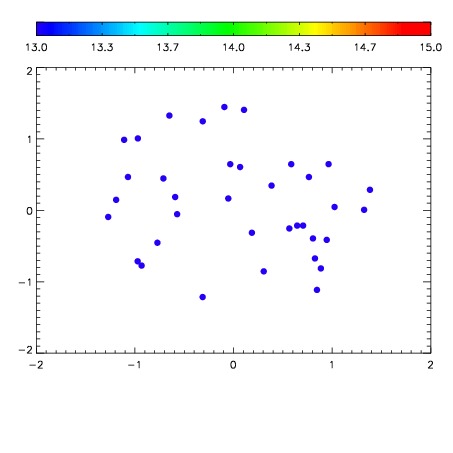

| Frame | Nreads | Zeropoints | Mag plots | Spatial mag deviation | Spatial sky 16325A emission deviations (filled: sky, open: star) | Spatial sky continuum emission | Spatial sky telluric CO2 absorption deviations (filled: H < 10) | |||||||||||||||||||||||
| 0 | 0 |
|
|
|
|
|
|
| IPAIR | NAME | SHIFT | NEWSHIFT | S/N | NAME | SHIFT | NEWSHIFT | S/N |
| 0 | 12320072 | 0.493229 | 0.00000 | 218.258 | 12320073 | -0.00221599 | 0.495445 | 216.399 |
| 1 | 12320071 | 0.493083 | 0.000146002 | 213.500 | 12320066 | 0.00000 | 0.493229 | 213.155 |
| 2 | 12320067 | 0.492871 | 0.000358015 | 210.973 | 12320070 | -0.00196748 | 0.495196 | 211.007 |
| 3 | 12320068 | 0.492712 | 0.000517011 | 156.661 | 12320069 | -0.00203268 | 0.495262 | 204.511 |